Most contractors and designers measure total lumens and call it a day. That’s a mistake that costs money and wastes light where it doesn’t belong.
Zonal lumens tell you exactly where light actually goes. At OpenLumen, we’ve seen how a quick zonal lumens check catches design problems before installation, saving time and budget on every project.
What Zonal Lumens Actually Tell You
The Basics: How Zonal Lumens Work
Zonal lumens measure light output within specific angular zones around a fixture. The Illuminating Engineering Society divides the space around a luminaire into ten-degree zones, starting from directly below (nadir) and moving outward to 180 degrees. For each zone, you calculate the average candela at the zone center, multiply it by a constant, and get the lumen output for that specific angular region. This matters because a fixture can produce 3,000 total lumens but send only 600 of those lumens into the 0–30 degree zone where you actually need them.
That’s the critical difference between total lumens and zonal lumens. Total lumens tells you the sum of everything a fixture emits; zonal lumens tells you where those lumens go and how much light reaches the task area. Most contractors grab the total lumen number, assume uniform distribution, and then wonder why a space feels dim or glare appears where it shouldn’t. Zonal lumens prevent that mistake.
Why Distribution Matters More Than You Think
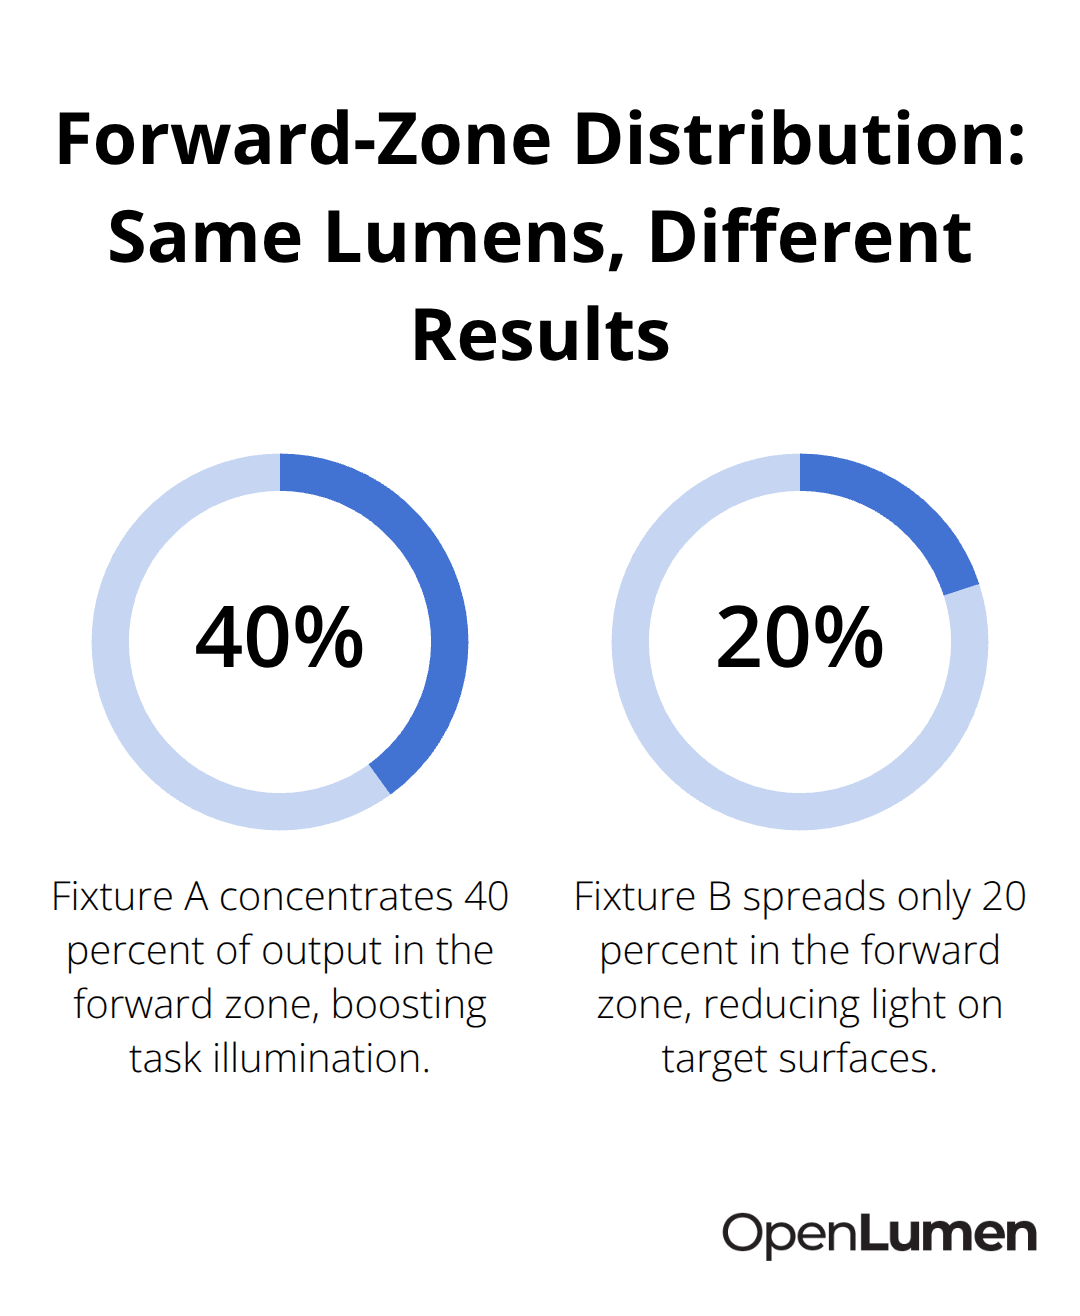
When you compare two fixtures with identical total lumens, their zonal distributions can be completely different. One might concentrate 40 percent of output in the forward zone while another spreads only 20 percent there. The IES Indoor Report provides the standard framework for reporting zonal lumens, breaking down distribution across forward zones (0–90 degrees) and back zones (90–180 degrees). This breakdown reveals whether a luminaire concentrates light where you need it or wastes output on unwanted areas.
Understanding zonal lumens transforms how you select fixtures. A downlight for a retail display needs high forward-zone output to illuminate merchandise; a parking lot fixture needs balanced side-zone distribution to cover ground without creating dark gaps. Without zonal lumen data, you’re essentially guessing which fixture works best for each application.
Efficiency and Real-World Output
Fixture efficiency depends on zonal lumens. Calculate efficiency by dividing total zonal lumens by the lamp’s rated lumens, then apply the luminaire’s optical efficiency factor. A lamp rated at 3,150 lumens in a fixture with 73.7 percent efficiency produces approximately 2,322 total fixture lumens. If that fixture’s 0–30 degree zone contains 618 lumens, it delivers about 26.6 percent of total fixture output in the forward direction.
That percentage tells you immediately whether the fixture suits a downlighting task or wastes light sideways and backward. Contractors and designers who skip photometric analysis end up oversizing fixtures to compensate for poor distribution, driving up energy costs and creating glare problems. A properly selected fixture with strong zonal concentration in the right direction uses less power, performs better, and costs less to operate over its lifetime.
The quick check takes minutes but saves thousands on every project. Once you understand what zonal lumens reveal about a fixture’s actual performance, you’re ready to run the analysis yourself.
How to Run a Zonal Lumens Quick Check
Get the Right Data Source
Start with the photometric file, not guesswork. Every fixture you consider should come with an IES or LDT file from the manufacturer-this is your raw data source. If a supplier can’t provide it, that’s a red flag that should disqualify them immediately. Open the file in photometric analysis software and navigate to the zonal lumen summary table. You’ll see lumens broken down by ten-degree zones: 0–10 degrees, 10–20 degrees, and so on through 180 degrees.
Focus on the Forward Zone
The 0–30 degree zone is where most contractors focus because it represents forward light output directly below and around the fixture. For a fixture rated at 3,150 lamp lumens, if the 0–30 degree zone shows 618 lumens, that’s 19.6 percent of total lamp output-a number you can compare directly against competing fixtures to see which concentrates light where you actually need it.
Calculate Real-World Output
Next, calculate what that zone lumen value becomes after accounting for luminaire efficiency. Multiply the zone lumens by the fixture’s efficiency percentage (typically 70–90 percent depending on optics quality). A 618 lumen zone in a 73.7 percent efficient fixture delivers 456 actual fixture lumens in that forward zone. This is the real number that matters for your illuminance calculations and client expectations. The entire analysis takes five minutes once you know where to look in the photometric data.
Avoid These Common Mistakes
Contractors frequently compare total lumens across fixtures without checking zonal distribution, leading to oversized or undersized selections. Never assume two fixtures with identical lumen ratings perform the same way-a narrow-beam downlight and a wide-flood general-area fixture both might claim 3,000 lumens but send vastly different amounts into specific zones. Another mistake is ignoring luminaire efficiency and working only from lamp lumens; this inflates expectations and causes disappointment when installed light levels fall short.
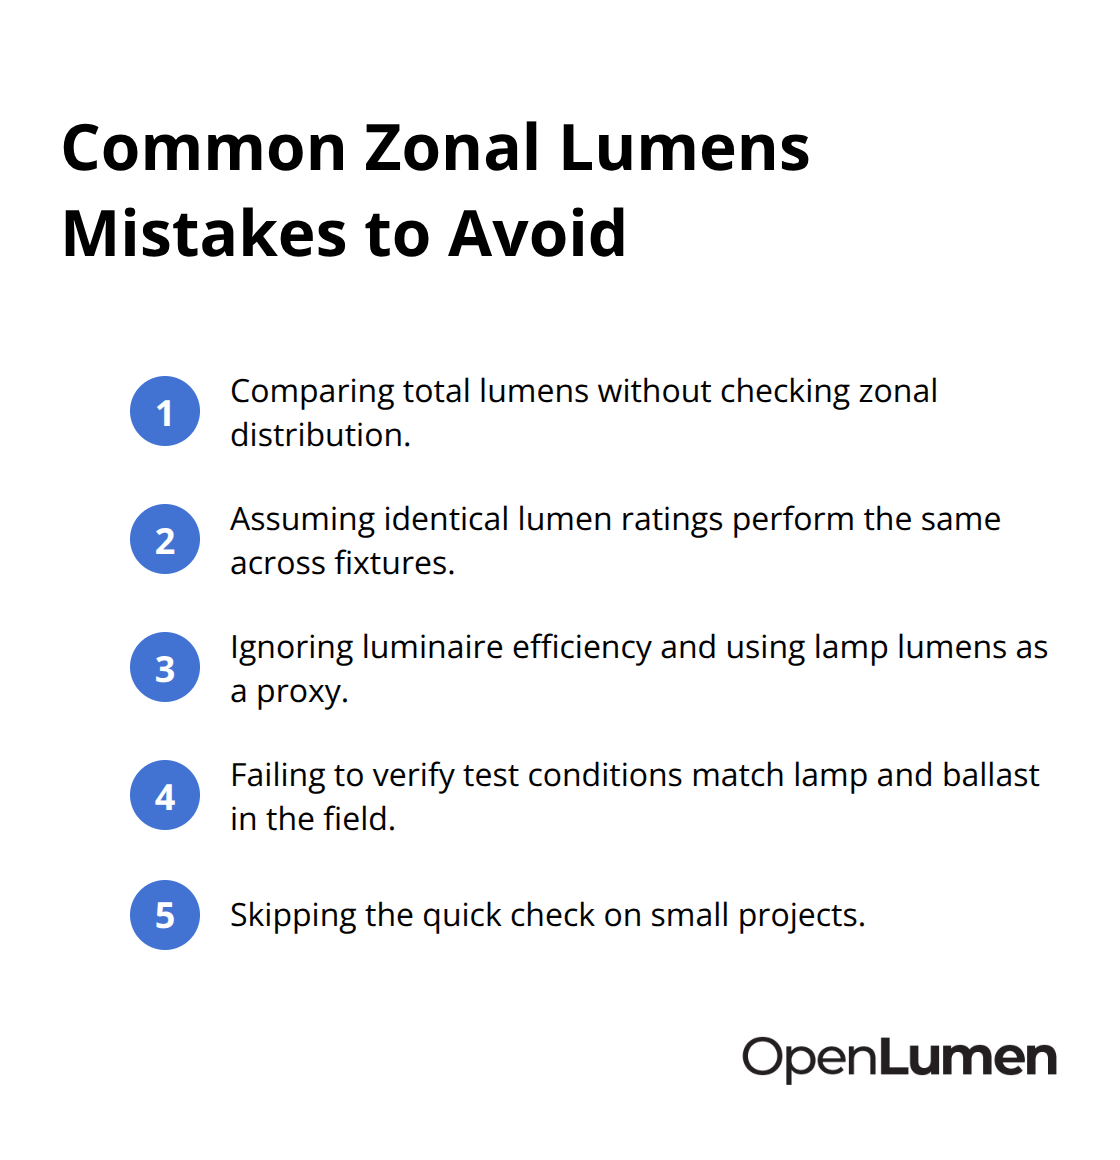
A third error happens when designers grab photometric data but fail to verify the test conditions match their actual lamp and ballast combination-a photometric test run at 100 percent ballast factor won’t apply if you run 90 percent ballast factor in the field. Always cross-reference the photometric file header with your exact lamp type, ballast specification, and test conditions before accepting the data. Finally, avoid the temptation to skip this step on small projects. A residential downlight retrofit or a parking lot fixture swap might seem minor, but selecting the wrong distribution pattern still costs money through energy waste and poor performance.
Make It Your Standard Practice
The quick check becomes a habit that prevents expensive mistakes on every scale of work. Once you master this five-minute analysis, you’ll spot distribution problems that other contractors miss-and that advantage translates directly into better-performing installations and stronger client relationships. The next step is learning how to apply these zonal lumen insights to real projects where the stakes are highest.
Real-World Applications of Zonal Lumens in Lighting Design
Retail Downlighting: The Merchandise Problem
A clothing store manager complained that merchandise near the perimeter looked dim despite adequate total lumen output overhead. The designer had selected fixtures rated at 2,800 lumens based on total output alone, but the photometric data revealed only 35 percent of those lumens fell into the 0–30 degree forward zone where the merchandise sat. Switching to a fixture with 55 percent forward-zone concentration-still 2,800 total lumens-solved the problem without adding power or fixtures. The store received better visibility, the client avoided a retrofit, and the designer learned that zonal lumens prevent costly mistakes that appear only after installation.
Parking Lot Lighting: Coverage and Cost Savings
A municipality upgraded a surface lot and specified 50-foot poles with 400-watt fixtures rated at 50,000 lumens each. The initial design created dark bands between fixture throw patterns because the selected luminaire concentrated too much output directly below the pole and too little in the 30–60 degree zones where ground coverage actually matters. The photometric analysis showed the fixture distributed only 18 percent of lumens into the 30–60 degree zone-a problem no total lumen count would reveal. Selecting a fixture with 32 percent output in that zone eliminated dark spots, improved safety uniformity, and reduced the number of fixtures needed from twelve to nine. That change saved $45,000 in hardware and installation costs on a single project.
Matching Fixtures to Actual Task Needs
Different applications demand different zonal distributions, and zonal lumens data tells you exactly which fixture fits which job. Accent lighting for artwork or merchandise displays needs 50–70 percent of output concentrated in the 0–30 degree forward zone to create dramatic contrast and visual impact without spilling light onto adjacent areas. General ambient lighting for offices or retail floors typically needs 35–50 percent in the forward zone with more balanced side-zone distribution to avoid harsh shadows and dark corners. Warehouse high-bay lighting with 30–40 foot ceiling heights requires a completely different pattern-often a wider distribution with significant output in the 30–60 degree zones to reach the floor from extreme angles. A contractor who understands these patterns stops ordering generic fixtures and starts matching distribution to function. The photometric file gives you the exact percentages for every application, eliminating guesswork and preventing the oversizing that wastes energy and money.
Presenting Data That Wins Client Confidence
Clients don’t understand zonal lumens, but they understand results. When presenting fixture options, translate zonal lumen data into outcomes they care about: light levels on surfaces, absence of glare, energy consumption, and cost. Show the 0–30 degree zone percentages for competing fixtures side by side, then explain what that difference means in real terms-one fixture delivers 40 percent more light to the work surface than another despite identical total lumens. Include the actual illuminance values from your photometric analysis at key measurement points: on the floor under the fixture, at the perimeter of the coverage area, and at eye level where glare becomes visible.
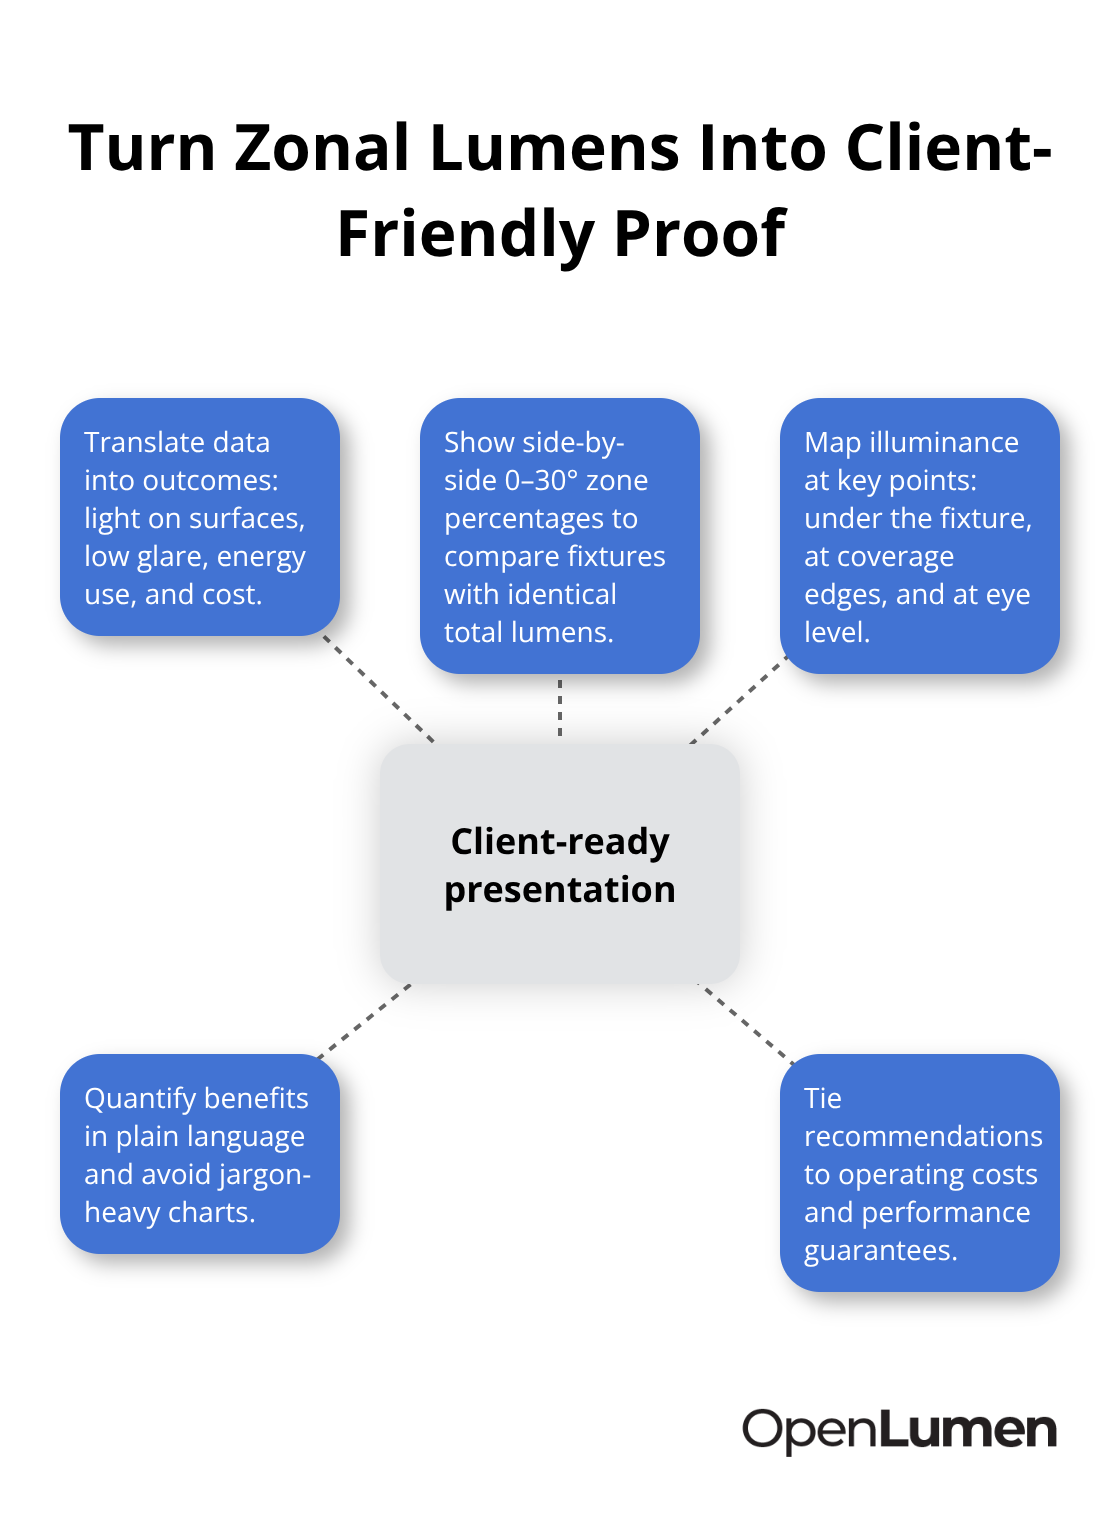
A simple one-page comparison with illuminance maps and cost-per-fixture numbers makes the case far more convincingly than technical lumen charts. Clients see that you’ve done the analysis, understand the tradeoffs, and selected fixtures for performance rather than price or convenience. That confidence translates into approvals, referrals, and willingness to pay for quality design work.
Final Thoughts
Zonal lumens quick checks transform how you select and specify fixtures. The five-minute analysis catches distribution problems before installation, prevents costly oversizing, and delivers better performance on every project. Total lumens alone tell only half the story-zonal data reveals where light actually goes and whether a fixture matches the task at hand.
Your installations perform better because you match distribution patterns to actual application needs rather than guessing based on total output. A retail space receives proper merchandise visibility, a parking lot achieves uniform ground coverage, and a warehouse reaches the floor without wasting energy on unwanted angles. You also save money by eliminating oversized fixtures that compensate for poor distribution, and your clients gain confidence when you present fixture comparisons backed by photometric data instead of generic lumen numbers.
Pull the photometric file on your next project, check the 0–30 degree zone percentage, calculate real-world output after efficiency losses, and compare competing fixtures side by side. OpenLumen streamlines this workflow by giving you instant zonal lumens analysis and professional reports without expensive software. Once this quick check becomes your standard practice, you’ll spot distribution problems that other contractors miss-and that advantage translates directly into better projects and stronger client relationships.
The information provided is for general educational purposes only and should not be considered professional engineering or lighting design advice. Always verify project requirements, local codes, and specifications with qualified professionals before making final decisions.