Most lighting designers struggle with one problem: they know their fixture’s total lumens, but not how light actually spreads across a space. That’s where zonal lumens calculation becomes essential.
At OpenLumen, we’ve seen countless projects fail because designers didn’t account for how light distributes in different zones. Understanding spatial light analysis separates good lighting design from great lighting design.
What Zonal Lumens Really Means
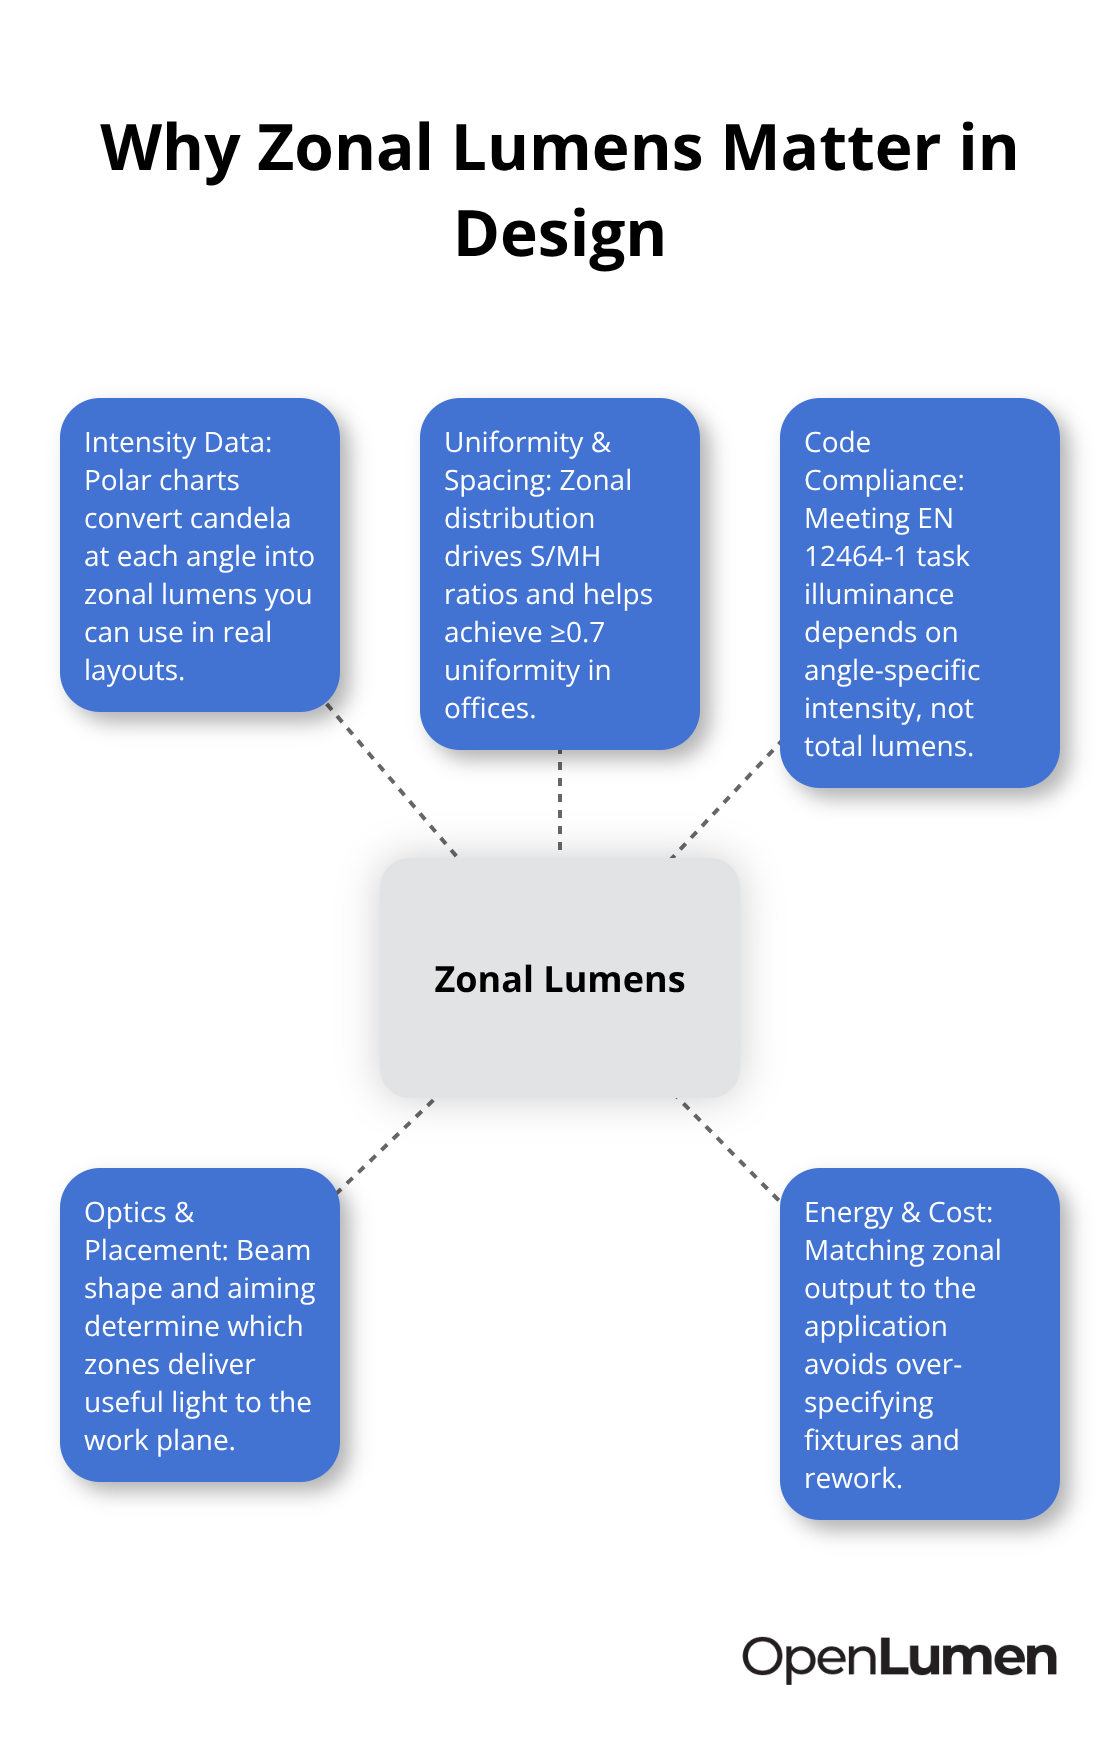
Zonal lumens describes how a fixture distributes light across specific angular zones rather than treating all light output as uniform in every direction. A fixture rated at 10,000 total lumens doesn’t send equal light upward, downward, and to the sides-it concentrates output in particular directions based on its optics. Zonal lumens calculation breaks down this distribution into measurable segments, typically using 10-degree zones across the fixture’s polar pattern. This matters because a 500-lux requirement in one zone might demand completely different fixture placement or optics than achieving 500 lux across an entire room. EN 12464-1 standards specify illuminance targets by task type, not by total lumens, which is why knowing how light actually travels from your fixture determines whether a project meets code or fails inspection. Total lumens alone tells you nothing about where that light goes.
Intensity Data Reveals What Total Lumens Hides
Manufacturers provide polar charts and intensity distribution curves that show candela values across angles. A fixture might produce 8,000 lumens total, but its candela output at 45 degrees differs sharply from output at 90 degrees. When you calculate zonal lumens, you convert these intensity values into actual lumen output within specific angular segments. This conversion uses the solid angle geometry of each zone-typically measured in steradians-to determine how many of those 8,000 total lumens actually land in the 30-to-40 degree zone versus the 60-to-70 degree zone. Real projects fail when designers assume uniform distribution and place fixtures without checking intensity data. A recessed downlight rated 7,200 lumens might deliver 3,000 lumens into the 0-to-30 degree cone and only 1,500 lumens into the 30-to-60 degree zone, leaving walls and task areas dark. Point-by-point calculations use the inverse square law and cosine correction-the formula E = I / r² × cosθ-and depend entirely on knowing the intensity value for each specific angle, not the total lumen figure. Zonal lumens calculation forces you to verify these intensity values before installation, catching problems during design rather than after mounting 40 fixtures in the wrong configuration.
Spacing and Uniformity Depend on Zonal Distribution
Spacing-to-mounting-height ratios (S/MH guidelines) exist specifically because zonal light distribution controls how evenly fixtures illuminate a space. A fixture with steep intensity falloff requires tighter spacing to avoid dark zones between installations. The Zonal Cavity Method and photometric layout planning both rely on understanding how light concentrates in certain zones to predict uniformity. Most contractors target a uniformity ratio of 0.7 or higher for offices, meaning the minimum illuminance should reach 70 percent of the average. Achieving this ratio requires knowing whether your fixture’s zonal lumens in the 45-degree zone provide enough light to fill gaps between fixtures mounted at standard 2.5-meter centers. Skip zonal analysis, and you either over-specify fixtures to force uniformity through brute force, wasting energy and budget, or under-specify and accept poor uniformity that creates visibility problems and safety hazards. A logistics warehouse lighting 2,500 square meters with 30 fixtures achieves roughly 200 lux average using the lumen method, but zonal lumens analysis confirms whether that 200 lux stays above 140 lux in the darker zones or drops to 80 lux in some areas. The difference between those outcomes determines whether workers can safely navigate the space and whether your design passes inspection.
How Zonal Data Informs Your Next Steps
Understanding zonal lumens prepares you to validate illuminance levels before installation and compare fixture performance across different zones. The intensity distribution curves and polar charts that manufacturers publish contain all the information you need to make these decisions. Tools that extract zonal lumens metrics instantly-such as those that provide polar charts, BUG ratings, and zonal lumens data in real time-help you verify fixture suitability without manual calculations. This verification step separates designs that work from designs that fail on the job site.
How to Calculate Zonal Lumens Step by Step
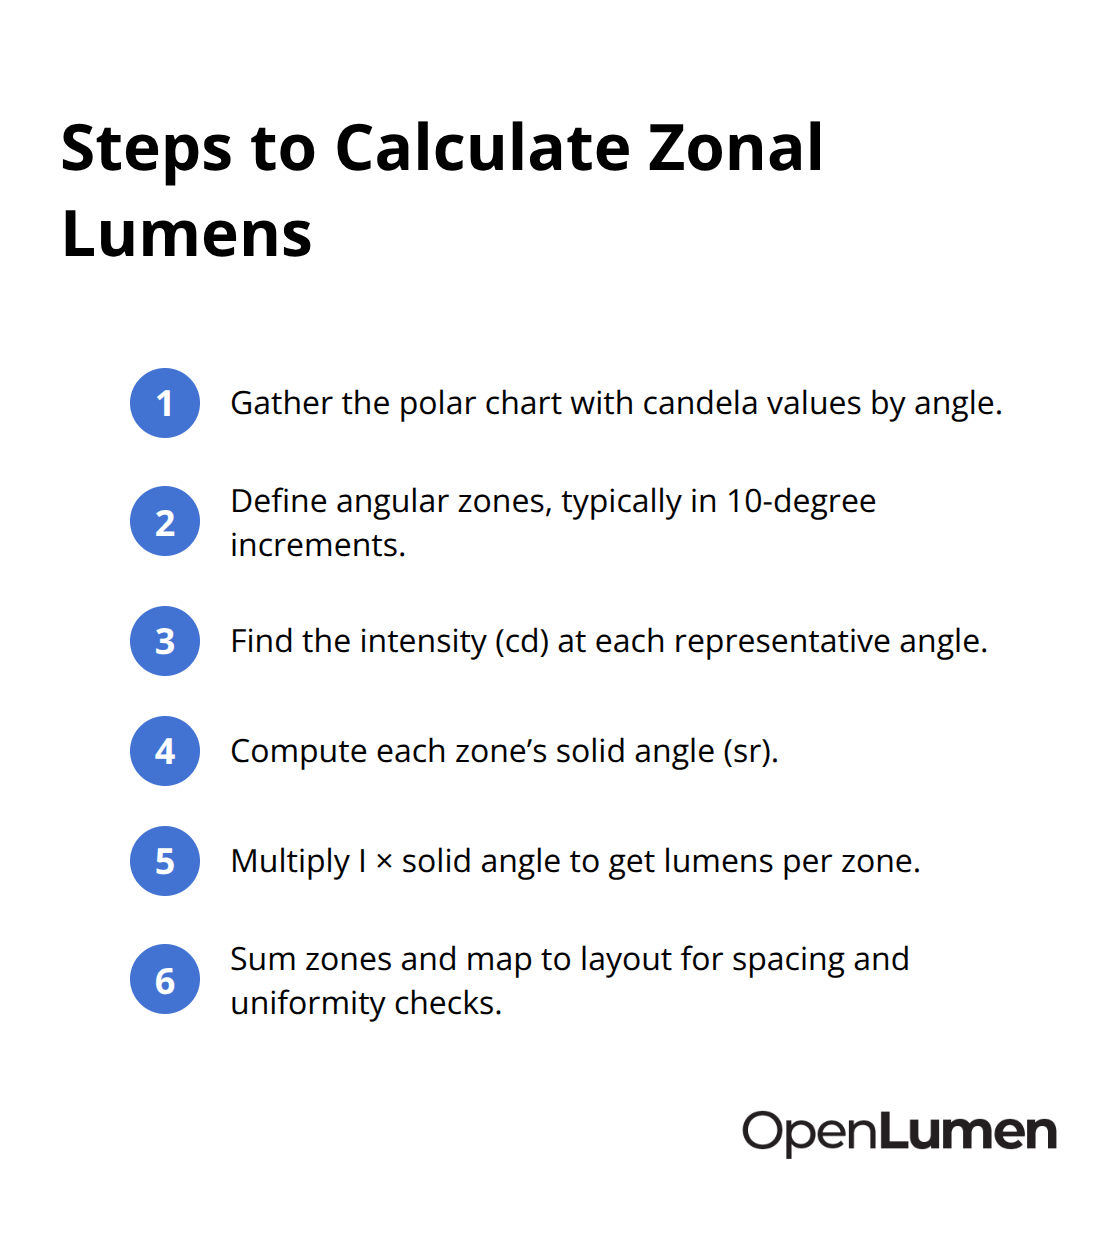
Zonal lumens calculation starts with intensity data from your fixture’s polar chart, then converts that intensity into actual lumen output within each angular zone. Manufacturers publish polar diagrams that show candela values at specific angles-typically in 10-degree increments-and this is your foundation. The conversion formula uses solid angle geometry: zonal lumens equals the intensity value at a given angle multiplied by the solid angle of that zone in steradians. For a recessed downlight, the 0-to-30 degree zone might show 800 candelas on the polar chart; multiply that by the solid angle of a 30-degree cone (roughly 0.84 steradians), and you get approximately 672 lumens concentrated in that zone.
This tells you precisely how much light actually reaches your work plane at different distances and angles from the fixture. A 7,200-lumen downlight does not distribute equally in all directions-it might deliver 3,400 lumens into the 0-to-30 degree zone, 2,100 lumens into the 30-to-60 degree zone, and only 1,700 lumens into the 60-to-90 degree zone. When you place fixtures on a 2.5-meter center spacing, the light from adjacent fixtures fills gaps through those wider-angle zones, and zonal lumens calculation reveals whether your spacing actually maintains the 0.7 uniformity ratio you need or creates dark patches that fail inspection. The inverse square law E = I / r² × cosθ depends entirely on knowing the intensity value for each specific angle, not the total lumens figure; without zonal analysis, you guess at which intensity value to use, and your calculations become unreliable.
Polar Charts Reveal Fixture Performance
Open the manufacturer’s photometric data sheet and locate the polar distribution diagram-this single chart contains all the intensity information you need to calculate zonal lumens. The polar chart displays candela output at various angles from the fixture’s nadir (straight down), typically showing values at 0, 10, 20, 30, 45, 60, 75, and 90 degrees. Read the candela value at each angle directly from the chart, then multiply by the solid angle of that 10-degree zone to get the zonal lumens. A typical LED recessed downlight shows high intensity at 0 degrees (directly below), declining steadily as angles increase, while a wide-distribution fixture maintains more consistent intensity across broader angles. The shape of this curve tells you everything about fixture performance: a steep curve means tight concentration and poor wall washing, while a flatter curve means better distribution but lower peak intensity. Compare two fixtures with identical 8,000-lumen ratings-one might have 1,200 candelas at 45 degrees while the other has 650 candelas at the same angle, making them completely different performers in the same space despite matching total lumens. EN 12464-1 specifies illuminance targets by task type, not by total lumens, which is why this intensity data determines whether your fixture choice works for the application. A precision assembly area requiring 500 lux at the work surface needs a fixture with intensity distribution that delivers adequate candelas at the mounting height and distance you’ve selected; total lumens alone never reveals this capability.
Extract Zonal Data Before Fixture Selection
Extract zonal lumens data for every fixture candidate before finalizing your specification. Tools that calculate and display zonal lumens metrics instantly-providing polar charts, BUG ratings, and zonal breakdown in real time-eliminate manual calculation and reduce errors. When you evaluate two competing fixtures for a warehouse task lighting application, compare their zonal lumens in the 30-to-60 degree zone specifically, since that zone typically fills gaps between fixtures and controls uniformity. A fixture with 2,800 lumens in the 30-to-60 degree zone performs differently than one with 1,900 lumens in the same zone, even if total lumens are similar. Spacing-to-mounting-height ratios exist because zonal distribution determines how tightly you must position fixtures to avoid dark zones; a fixture with steep intensity falloff requires 1.5:1 spacing while a wider-distribution fixture tolerates 2.5:1 spacing, directly affecting your fixture count and project cost. Calculate the number of fixtures needed using the lumen method as a starting point-for a 2,500-square-meter logistics space targeting 200 lux, you might estimate 30 fixtures-then verify that those 30 fixtures actually maintain uniformity through zonal lumens in the wider-angle zones. Skip this verification step and you either over-specify fixtures to force uniformity through excess output, wasting energy, or under-specify and accept dark zones that create safety hazards. Once you confirm zonal distribution matches your spacing and illuminance targets, you move into practical validation on the job site.
Putting Zonal Lumens into Real Projects
A 2,500-square-meter logistics warehouse requires 200 lux average illuminance according to EN 12464-1, but that number means nothing until you verify whether your fixture selection actually delivers 200 lux across the entire floor without dark patches. The lumen method gives you an initial fixture count-roughly 30 fixtures of 19,000 lumens each for this warehouse-but zonal lumens analysis confirms whether those 30 fixtures actually work at your planned 2.5-meter spacing or whether you need tighter spacing and more fixtures to maintain a 0.7 uniformity ratio.
Extract Zonal Data for Your Top Fixture Candidates
Start by extracting zonal lumens data for your top two or three fixture candidates. For a downlight mounted at 6 meters above the work plane with 2.5-meter center spacing, calculate the illuminance at the perimeter zones using E = I / r² × cosθ, where I is the intensity value at 45 degrees from the polar chart. If your fixture delivers 650 candelas at 45 degrees, the illuminance at a point 2 meters away horizontally and 6 meters below the fixture is roughly 18 lux-this light from adjacent fixtures fills the gap between your main fixtures. Multiply this by the number of surrounding fixtures contributing to that point, and you either confirm that 200 lux holds across the space or discover that you need 35 fixtures instead of 30. The difference is roughly 15 to 20 percent higher energy consumption and material cost; skipping this step costs money and wastes energy.
Match Fixture Intensity to Your Illuminance Target
A precision assembly area demanding 500 lux at the work surface needs fixtures with sufficient intensity in the 30-to-60 degree zone to deliver adequate light at your chosen mounting height. A fixture with only 1,200 candelas at 45 degrees falls short; you need 1,800 to 2,000 candelas at that angle to achieve 500 lux with standard fixture spacing. Comparing two fixtures side by side using zonal lumens reveals this performance gap instantly, while comparing total lumens alone masks the difference entirely.
Validate Performance on Site Before Full Installation
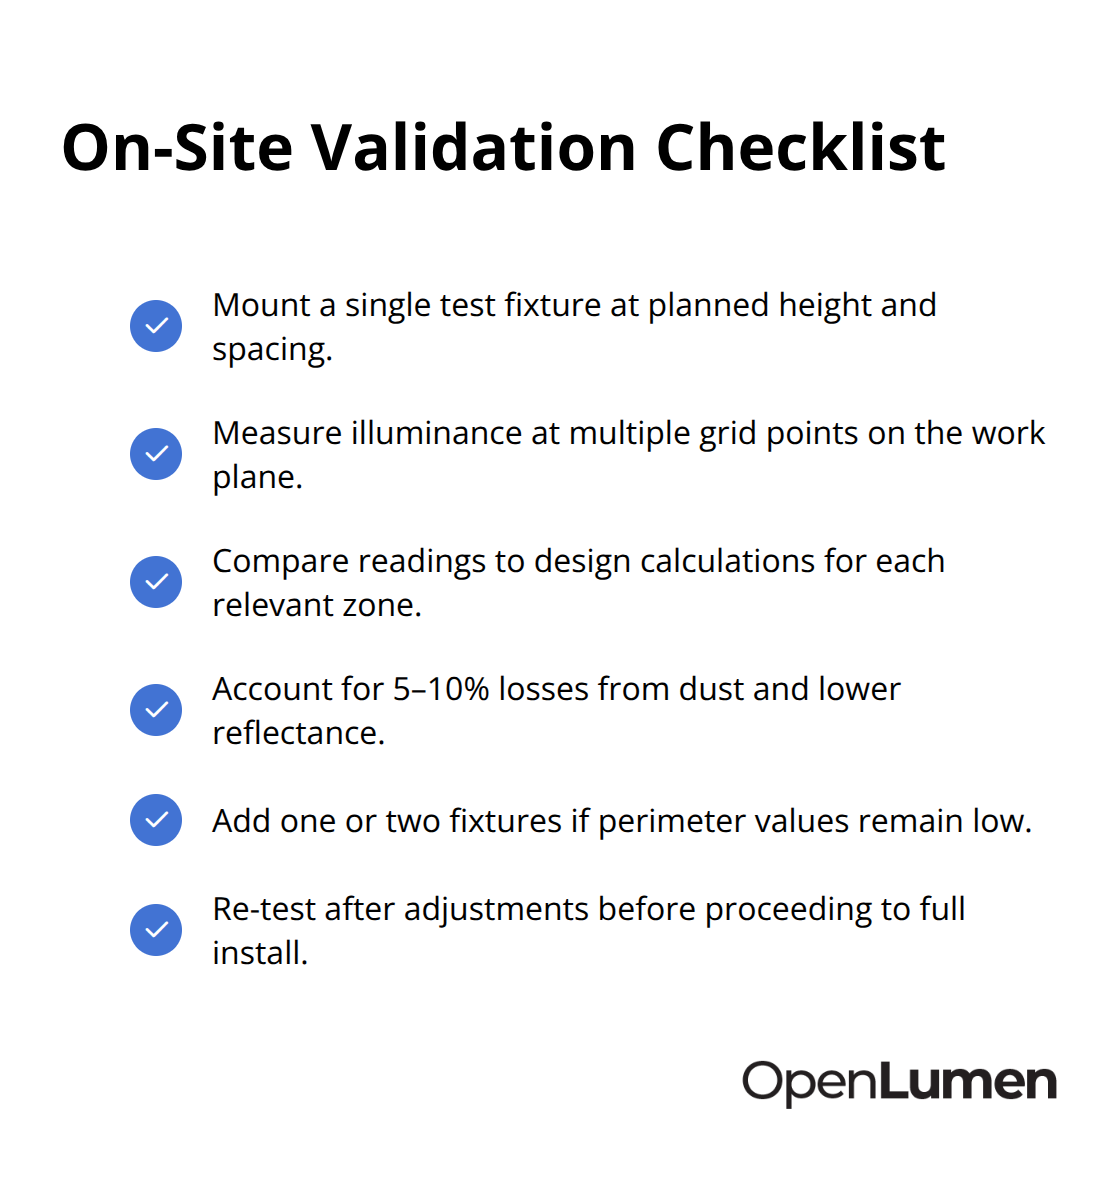
Mount a single test fixture at your planned height and spacing, then use an illuminance meter to measure light levels at multiple points across the work plane. Compare your measured values to the zonal lumens calculations you performed during design; if measured illuminance at the perimeter falls 10 to 15 percent short of your calculation, the discrepancy typically comes from room reflectance being lower than your assumption or dirt on surfaces reducing zonal lumens in practice. EN 12464-1 assumes clean, well-maintained spaces, so a warehouse with dust accumulation loses roughly 5 to 10 percent of calculated illuminance depending on surface finishes and air quality. Adjust your fixture count upward by one or two units to account for this real-world loss, then proceed with full installation.
Test Task Lighting at Actual Work Heights
For task lighting in specific areas-a welding station requiring 200 lux per EN 12464-1, or a precision inspection area needing 750 lux-mount the fixture directly above the task surface and measure illuminance at the actual work height. Zonal lumens calculation predicts this measurement with accuracy within 5 to 8 percent when you use correct intensity data from the polar chart and account for room reflectance through the Zonal Cavity Method. If your calculation predicted 200 lux and you measure 188 lux, the design is sound and installation can proceed. If you measure 150 lux, either your fixture choice is wrong or your mounting height is too high; adjust one variable and retest. This validation step takes 30 minutes and prevents disputes with clients over illuminance shortfalls after installation.
Final Thoughts
Zonal lumens calculation transforms lighting design from guesswork into measurable accuracy. Total lumens alone tells you nothing about where light actually travels, and intensity data from polar charts reveals the real performance of your fixtures across different angles and zones. This knowledge separates designs that pass inspection from those that fail on the job site.
Accurate zonal analysis prevents costly mistakes during the design phase. When you validate illuminance levels before installation using intensity data and the inverse square law, you catch problems before mounting 30 or 40 fixtures in the wrong configuration. A logistics warehouse needing 200 lux across 2,500 square meters might require 30 fixtures or 35 fixtures depending on zonal distribution-that 5-fixture difference represents 15 to 20 percent higher energy consumption and material cost if you guess wrong.
Real-world validation confirms your calculations work. Mount a test fixture, measure illuminance at multiple points, and compare results to your zonal lumens predictions-if measured values fall within 5 to 8 percent of your calculations, the design is sound and installation proceeds with confidence. Extract zonal lumens data for every fixture candidate before finalizing your specification, and use tools that provide polar charts and zonal breakdown instantly to eliminate manual calculation and reduce errors so you design, sell, and validate lighting faster.
The information provided is for general educational purposes only and should not be considered professional engineering or lighting design advice. Always verify project requirements, local codes, and specifications with qualified professionals before making final decisions.