Most contractors and designers choose fixtures based on total lumens alone. This misses the real picture of how light actually lands on your space.
Zonal lumens analysis shows you exactly where light goes and how much reaches each area. At OpenLumen, we’ve seen projects transform when teams shift from guessing to measuring actual light distribution.
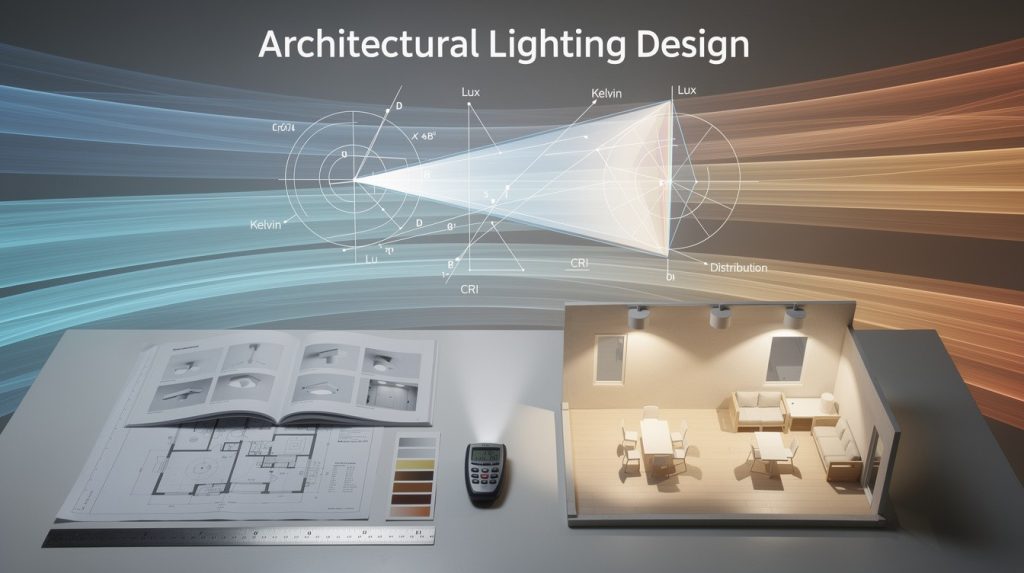
What Zonal Lumens Actually Measure
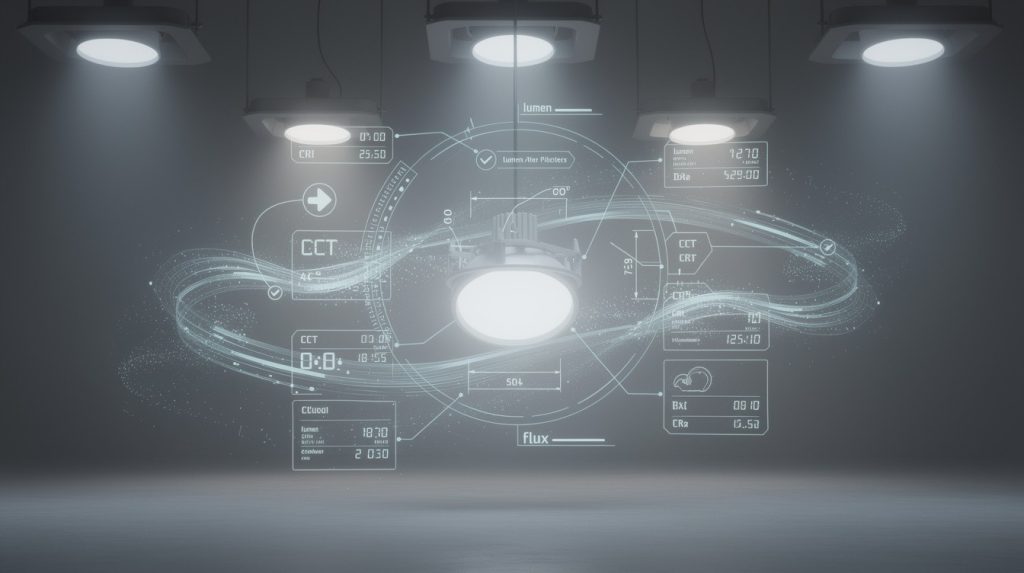
Zonal lumens break down how a fixture distributes light across ten-degree angular zones instead of lumping everything into a single total. The IES Indoor Report standard defines this: a fixture’s output gets divided into zones from 0° to 180°, and each zone receives its own lumen count. This matters because a 3,000-lumen fixture might send 800 lumens downward (0–30°), 1,200 lumens at mid-angles (30–60°), and 1,000 lumens upward (60–180°). Total lumens alone tells you nothing about where that light actually lands. When you specify a fixture based only on total output, you operate without real visibility into performance in the spaces where it counts most-directly below the fixture where people work and where glare becomes a problem.
The Marketing Number vs. Real Performance
Total lumens is a marketing number. A fixture rated at 3,000 lumens might deliver only 1,500 lumens into the 0–30° zone where task lighting matters, while dumping excess light sideways and upward where it creates glare and wastes energy. The zonal lumen breakdown exposes this inefficiency immediately. Photometric Toolbox and similar analysis tools calculate zonal lumens by averaging the candela intensity at each zone’s center point and multiplying by the zone’s geometric constant. For a practical example, if a fixture shows 618 lumens in the 0–30° zone and the lamp itself produces 3,150 rated lumens, that fixture delivers only about 19.6% of its lamp’s output where most task work happens. Many contractors discover they can cut fixture count by 30–40% once they switch from total lumens to zonal analysis, because the right distribution eliminates dark spots and over-lit areas simultaneously. The uniformity improves, energy use drops, and glare risk falls.
How Lamp Changes Shift Your Distribution
Changing a lamp or ballast inside the same fixture housing changes the zonal lumen distribution-sometimes dramatically. A narrow-beam lamp produces a different candela curve than a wide-beam lamp, which shifts how lumens concentrate in each zone. This is why photometric files must match your exact lamp and ballast configuration; the wrong IES file leads to calculations that miss reality entirely. Room Cavity Ratio and Coefficient of Utilization depend on zonal data too. A CU of 0.61 in a 14.7 by 9.3 meter office space means 61% of fixture output actually reaches the working plane, while 39% scatters into walls, ceiling, or above eye level. Without zonal analysis, you cannot predict uniformity or identify whether a checkered pattern of bright and dark spots will appear on your floor. Teams that adopt zonal lumens early catch these problems during design, not after installation when it becomes expensive to fix.
Moving From Guesswork to Measured Results
The shift from total lumens to zonal analysis transforms how contractors and designers approach fixture selection. Instead of assuming a high lumen count guarantees good results, you now verify exactly what each fixture contributes to your target zones. This precision eliminates the trial-and-error cycle that wastes time and money on site. With zonal data in hand, you can compare two fixtures with identical total lumens and immediately see which one actually performs better for your specific space and task requirements. The next section shows you how to access this data and put it to work in real projects.
Where Zonal Lumens Make the Biggest Difference
Office Spaces Reveal the Real Cost of Ignoring Distribution
Office spaces with 500-lux task requirements expose why zonal lumens matter immediately. A representative 14.7 by 9.3 meter office needing 500 lux average illuminance at the working plane requires approximately 127,290 lumens total flux when you account for a Coefficient of Utilization of 0.61 and a maintenance factor of 0.88. That sounds like you need dozens of fixtures, but zonal lumens analysis shows the real picture. A fixture with 64% downward distribution (0–90°) and 36% upward distribution (90–180°) sends 3,000 lumens downward where work happens and 1,700 lumens upward toward the ceiling.
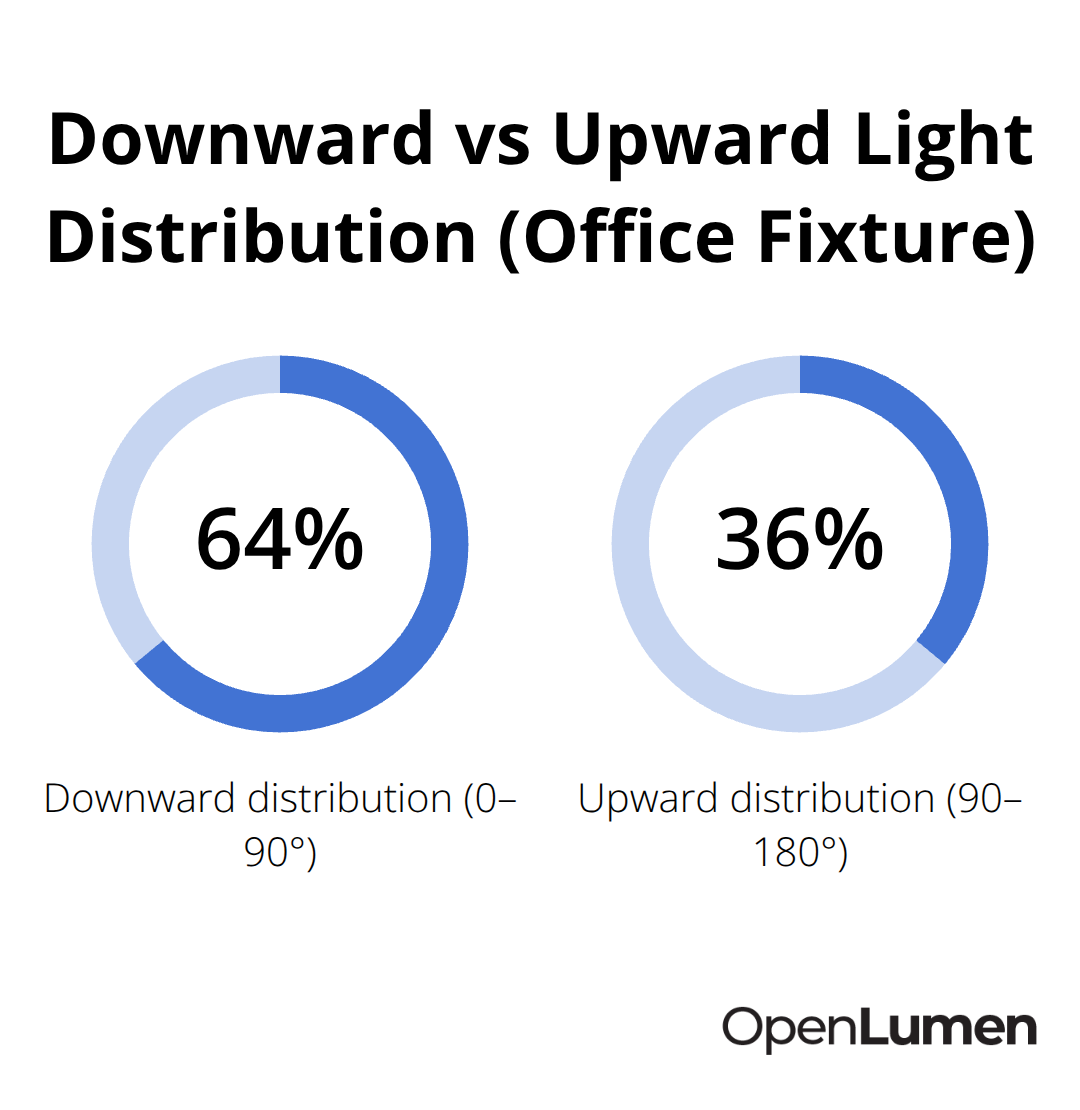
A fixture with inverse distribution wastes half its output above eye level, creating ceiling glare and wasting energy.
When you compare two 4,700-lumen fixtures side by side using zonal data, one delivers 3,000 lumens to the task zone while the other delivers only 1,500. The total lumen rating masks this 100% difference in actual performance. Most contractors specify the cheaper fixture without checking zonal distribution, then wonder why the space feels dim or glary.
The Checkered-Pattern Problem That Total Lumens Hides
Office lighting also exposes the checkered-pattern problem that total lumens never reveals. A narrow-beam fixture rated at 4,000 lumens might concentrate 2,200 lumens in the 0–30° zone directly below it, creating bright spots on the floor separated by darker areas. Spacing those fixtures 12 feet apart in a 533-square-foot area produces visible dark zones between fixtures, even though the average footcandle reading hits your target.
Zonal lumens analysis predicts this before installation by showing exactly how much light lands at 3 feet height in each zone. You catch the problem during design and adjust spacing or beam angle accordingly. This prevents the costly mistake of discovering uniformity failures after the fixtures are mounted.
Retail, Hospitality, and Specialized Applications
Retail and hospitality spaces demand different zonal distributions entirely. A jewelry counter needs intense, focused light in the 0–30° zone to highlight merchandise without glare, which means selecting fixtures with 50%+ of output concentrated downward. A restaurant dining area needs the opposite: softer, more dispersed light with 45–55% upward distribution to bounce off the ceiling and create ambient fill light.
Surgical lighting represents the extreme end of zonal analysis necessity. Operating room fixtures deliver 160,000+ lumens total with precise color temperature between 4000–4500 Kelvin and shadowless performance using multi-source arrays. A photometric report for surgical lighting shows detailed zonal distribution across the entire 0–180° range to confirm that light reaches the surgical field uniformly without hot spots or shadows cast by the surgeon’s body. No surgeon accepts a fixture chosen by total lumens alone because the stakes are literal visibility during critical procedures.
Horticulture Lighting and PAR Distribution
Horticulture lighting also hinges on zonal lumens because plants respond to photosynthetically active radiation, not just visible light. Modern LED grow fixtures achieve 2.5–3.2 micromoles per joule PAR efficacy compared to high-pressure sodium at 1.7–1.9 micromoles per joule. That efficiency gain means you reach target photosynthetic photon flux density with fewer fixtures and lower energy cost.
Only when you analyze the zonal distribution of PAR output across the growing zone do you confirm the fixture actually covers your canopy height and spacing without creating light-starved gaps. A fixture with poor zonal distribution in the 30–60° zone might miss lower plant canopy entirely, requiring additional fixtures that negate the efficiency advantage.
How Real Projects Transform With Zonal Analysis
Real projects confirm this pattern repeatedly. When a contractor shifts from total lumens specification to zonal lumens analysis, fixture counts drop 20–30% because distribution efficiency eliminates redundancy. Energy consumption falls faster than fixture count because you’re not over-lighting non-critical zones. Uniformity improves because zonal data guides spacing and beam-angle selection to match actual room geometry and task requirements.
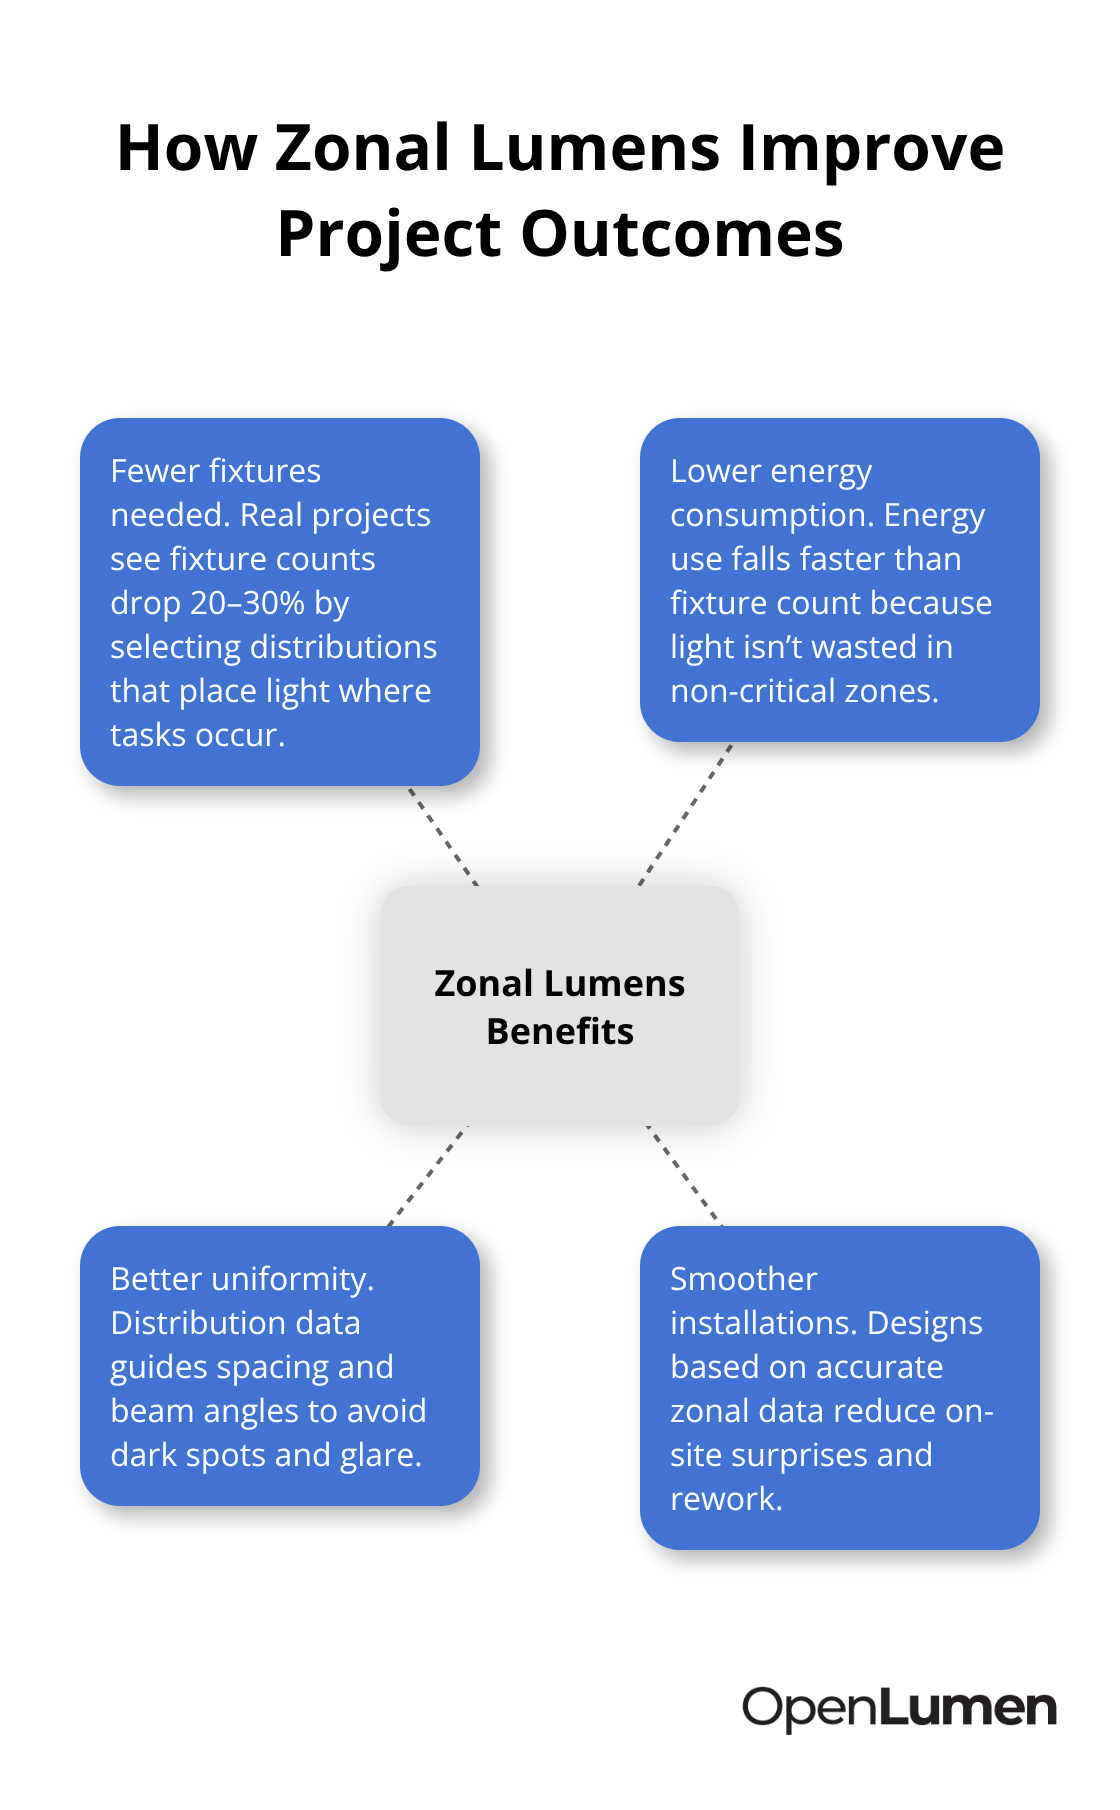
The initial design takes longer because analysis replaces guessing, but installation becomes faster and more predictable because surprises disappear. This foundation of accurate zonal data sets the stage for the next critical step: accessing and interpreting the photometric information that powers these decisions.
Getting Zonal Lumens Data Into Your Hands
Access Photometric Files From Manufacturers
The biggest barrier to zonal lumens analysis isn’t understanding the concept-it’s accessing the data without spending thousands on specialized software or waiting weeks for lab reports. Photometric files in IES format contain all the candela distribution information you need, and manufacturers provide them free. Download the correct IES file that matches your exact fixture model, lamp type, and ballast configuration from the manufacturer’s website or request it directly from their technical team. The file name usually includes these details: a fixture rated at 3,000 lumens with a T5 lamp produces a different zonal distribution than the same fixture with a different lamp, so precision here matters.
Extract Zonal Lumens Values With Analysis Tools
Once you have the file, you need tools to extract meaningful zonal lumen values. Photometric Toolbox is the industry standard for this work, calculating zonal lumens through averaging candela intensity at each ten-degree zone’s center and multiplying by that zone’s geometric constant. A fixture showing 618 lumens in the 0–30° zone out of 3,150 total lamp lumens means 19.6% of output lands in your critical task zone. This single number tells you whether the fixture wastes light or concentrates it where you need it.
Compare Fixture Output Against Space Requirements
Most designers stop at the 19.6% figure and call it done, but you need one more step: compare that percentage against your specific space requirements. A jewelry retail counter demands 30%+ of output in the 0–30° zone, while a general office at 500 lux can work with 20–25% if the fixture’s distribution spreads evenly across mid-angles. The gap between what the fixture delivers and what your space needs drives your final fixture count and layout decisions. A Room Cavity Ratio of 5 in a standard office means roughly 61% of fixture output reaches the working plane through direct contribution and reflection-but only if your fixture’s zonal distribution actually sends light downward rather than sideways.
Streamline Analysis With Browser-Based Platforms
Browser-based lighting platforms streamline this entire process through integrating photometric analysis directly into design workflows, eliminating the need to juggle multiple software tools. These platforms provide instant access to polar charts, BUG ratings, and zonal lumens summaries without downloading IES files or running separate calculations. For contractors and distributors who design dozens of projects monthly, this speed advantage translates to real time savings. You input room dimensions, working plane height, and surface reflectances, then the platform calculates average illuminance, uniformity, and zonal lumen contribution in real time. When you adjust fixture spacing or swap a fixture for a different model, the zonal analysis updates immediately so you see exactly how distribution changes affect your target zones.
Iterate Design Decisions With Real-Time Feedback
The practical workflow looks like this: select your fixture from a verified luminaires library, input your space geometry, run the analysis, and check whether the 0–30° zone lumens hit your target. If not, adjust spacing or swap the fixture.
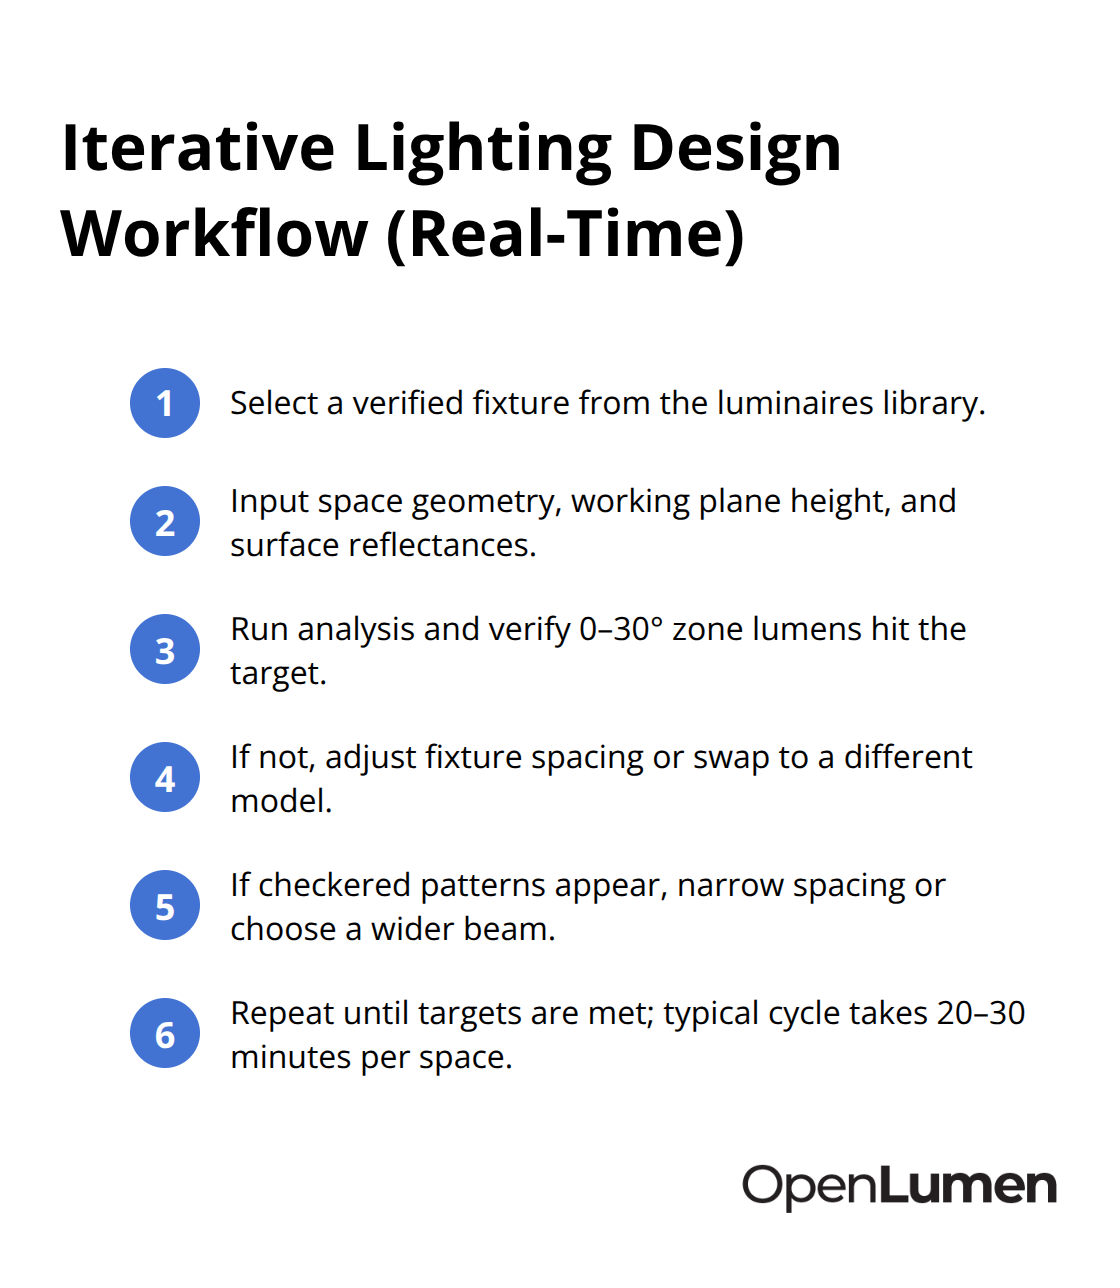
If checkered patterns appear in the illuminance map, narrow your spacing or choose a fixture with wider beam distribution. This iterative design powered by actual zonal data takes 20–30 minutes per space instead of the guesswork cycle that stretches across days or weeks on site. Software that displays zonal lumens alongside illuminance maps catches mismatches between fixture distribution and space requirements instantly, preventing costly surprises after installation.
Final Thoughts
Zonal lumens analysis transforms lighting design from guesswork into measurable precision. The shift from total lumens to zonal distribution reveals where light actually lands, eliminates dark spots and glare, and cuts fixture counts by 20–40% in real projects. Contractors and designers who adopt this approach stop wasting time on site adjustments and energy on over-lit spaces.
A 14.7 by 9.3 meter office space that appears to need dozens of fixtures actually requires far fewer when zonal data guides your selection. A retail counter that seemed dim under standard fixtures suddenly performs when you choose a model with 50%+ output concentrated in the 0–30° zone. Surgical lighting, horticulture, hospitality, and specialized applications all depend on zonal lumens analysis to meet their specific performance demands.
Start with your next project by downloading one photometric file and running a zonal lumens analysis through OpenLumen, which eliminates the need for expensive software or specialized training. Input your space geometry, select fixtures from a verified library, and receive instant zonal lumens summaries alongside illuminance maps. The difference in accuracy, efficiency, and confidence will be impossible to ignore.
The information provided is for general educational purposes only and should not be considered professional engineering or lighting design advice. Always verify project requirements, local codes, and specifications with qualified professionals before making final decisions.