Photometric reports are often the bridge between technical design and real-world execution. When stakeholders can’t read your layouts, projects stall, budgets slip, and trust erodes.
At OpenLumen, we’ve seen countless projects derailed by unclear reporting. The solution isn’t complex-it’s clarity. This guide shows you how to create photometric layouts that actually communicate with your team, clients, and inspectors.
Why Stakeholders Need Clear Photometric Reports
Non-technical decision makers don’t care about candela distributions or zonal lumen summaries. They care about whether the lights will work, whether the project meets code, and whether the investment is sound. Hand a property owner or facility manager a photometric report filled with polar plots and technical jargon, and you’ve already lost them. Projects stall because stakeholders can’t validate the design themselves, inspectors reject layouts due to missing compliance data, and contractors waste time redoing work because specifications weren’t clear from the start. The fix is straightforward-structure your report so non-technical readers instantly grasp what’s being proposed, why it matters, and what happens next.
Translating Numbers Into Decisions
Start with a one-page executive summary that states the target footcandle levels, the average maintained illuminance you’re delivering, and the uniformity ratio you’ve achieved. For a parking lot, say something like this: target was 3 footcandles across the lot with 4:1 uniformity; your design delivers 3.2 fc average with 4.2:1 uniformity, meeting code and providing even light coverage. Skip the technical language. A property manager doesn’t need to know about coefficient of utilization-they need to know the lights will be bright enough, evenly distributed, and compliant.
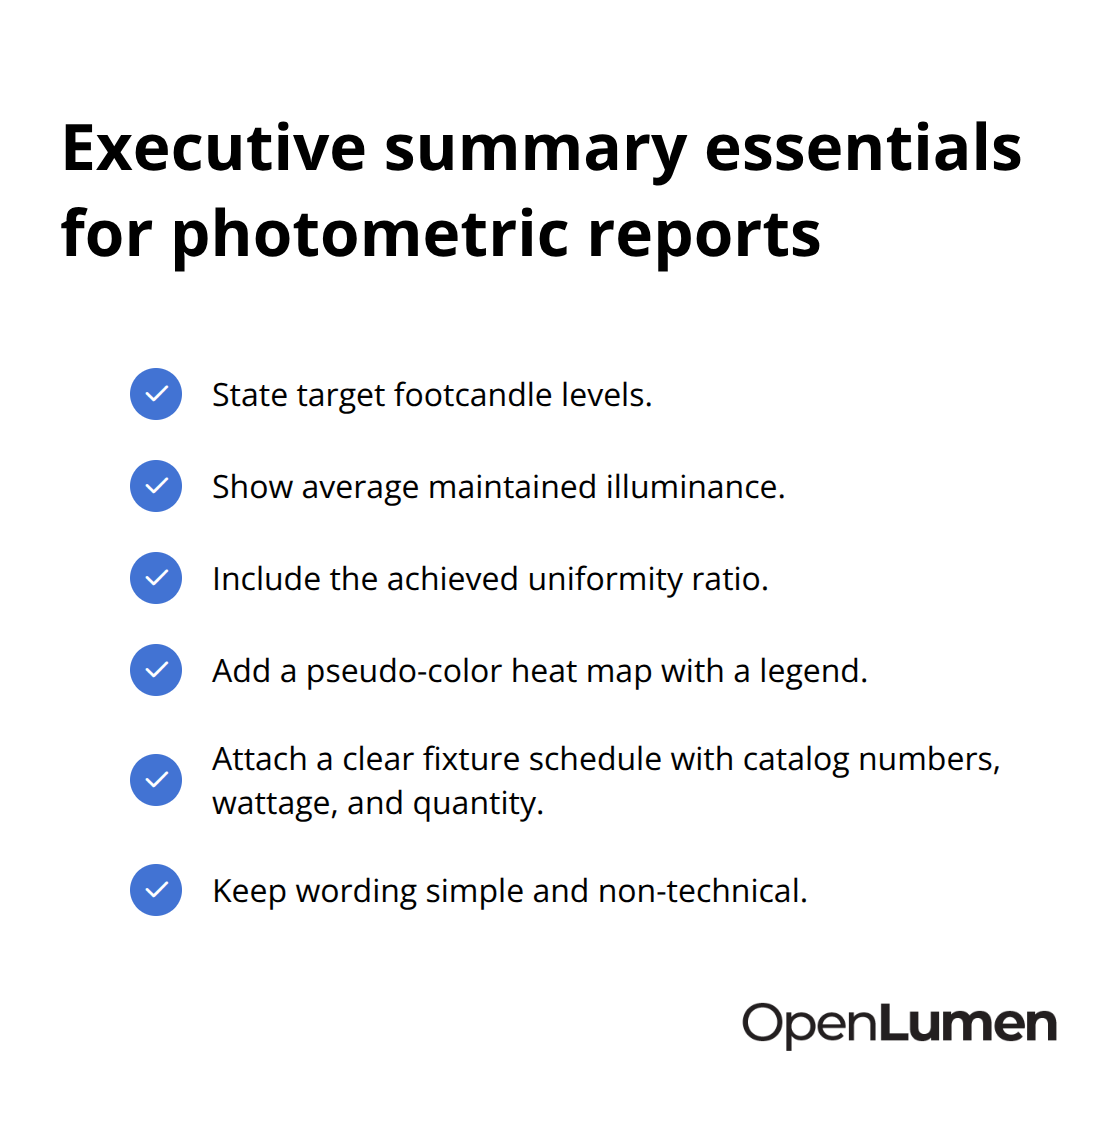
Include a simple visual: a pseudo-color heat map showing footcandle levels across the space in colors, with a legend mapping colors to brightness ranges. This takes seconds to scan and shows instantly where light is adequate and where it’s not.
Add the fixture schedule with catalog numbers, wattage, and quantity so there’s no ambiguity about what will actually be installed. Many inspectors and permit offices now require this level of detail; leaving it out guarantees a rejection and a delay.
Building Confidence Through Compliance Proof
Stakeholders want assurance that your design meets applicable standards. State which standards you’ve designed to-IES guidelines for illuminance levels, NCAA requirements for sports facilities, local municipal codes for outdoor spaces. Reference them by name and cite the specific values. If a code requires 50 footcandles in a warehouse aisle and your design delivers 52 fc average with minimum of 48 fc, state so explicitly. Include the light loss factor you’ve applied; typical LED installations use an LLF of 0.70 to 0.85 to account for dirt, aging, and environmental effects over time. If you design to initial conditions without LLF, your stakeholders will see 15 to 30 percent higher performance in the field than promised, which erodes trust when reality doesn’t match the report.
A well-structured report shows the calculation grid spacing, mounting heights, and all assumptions so an inspector or consultant can verify your work independently. Include the IES photometric data file reference or indicate that manufacturer IES files were used for the simulation. This transparency prevents disputes later and demonstrates you’ve completed the work correctly.
Specification Clarity Prevents Installation Errors
Vague equipment lists create costly mistakes on site. List every fixture type separately with its catalog number, wattage, lumen output, beam angle, color temperature, and exact quantity. If your design calls for 12 fixtures of one model and 8 of another, make that distinction clear-don’t lump them together. Contractors installing the wrong fixture type or quantity will either under-light the space or waste budget on excess equipment. Include mounting heights and aiming angles for each fixture location on the layout plan itself, not buried in footnotes. When a property owner or facility manager sees that you’ve accounted for real-world conditions and cited the standards that apply, they move forward with confidence instead of hesitation, and your team can proceed directly to procurement and installation without rework.
What Makes a Photometric Report Readable and Actionable
Place the Footcandle Grid Front and Center
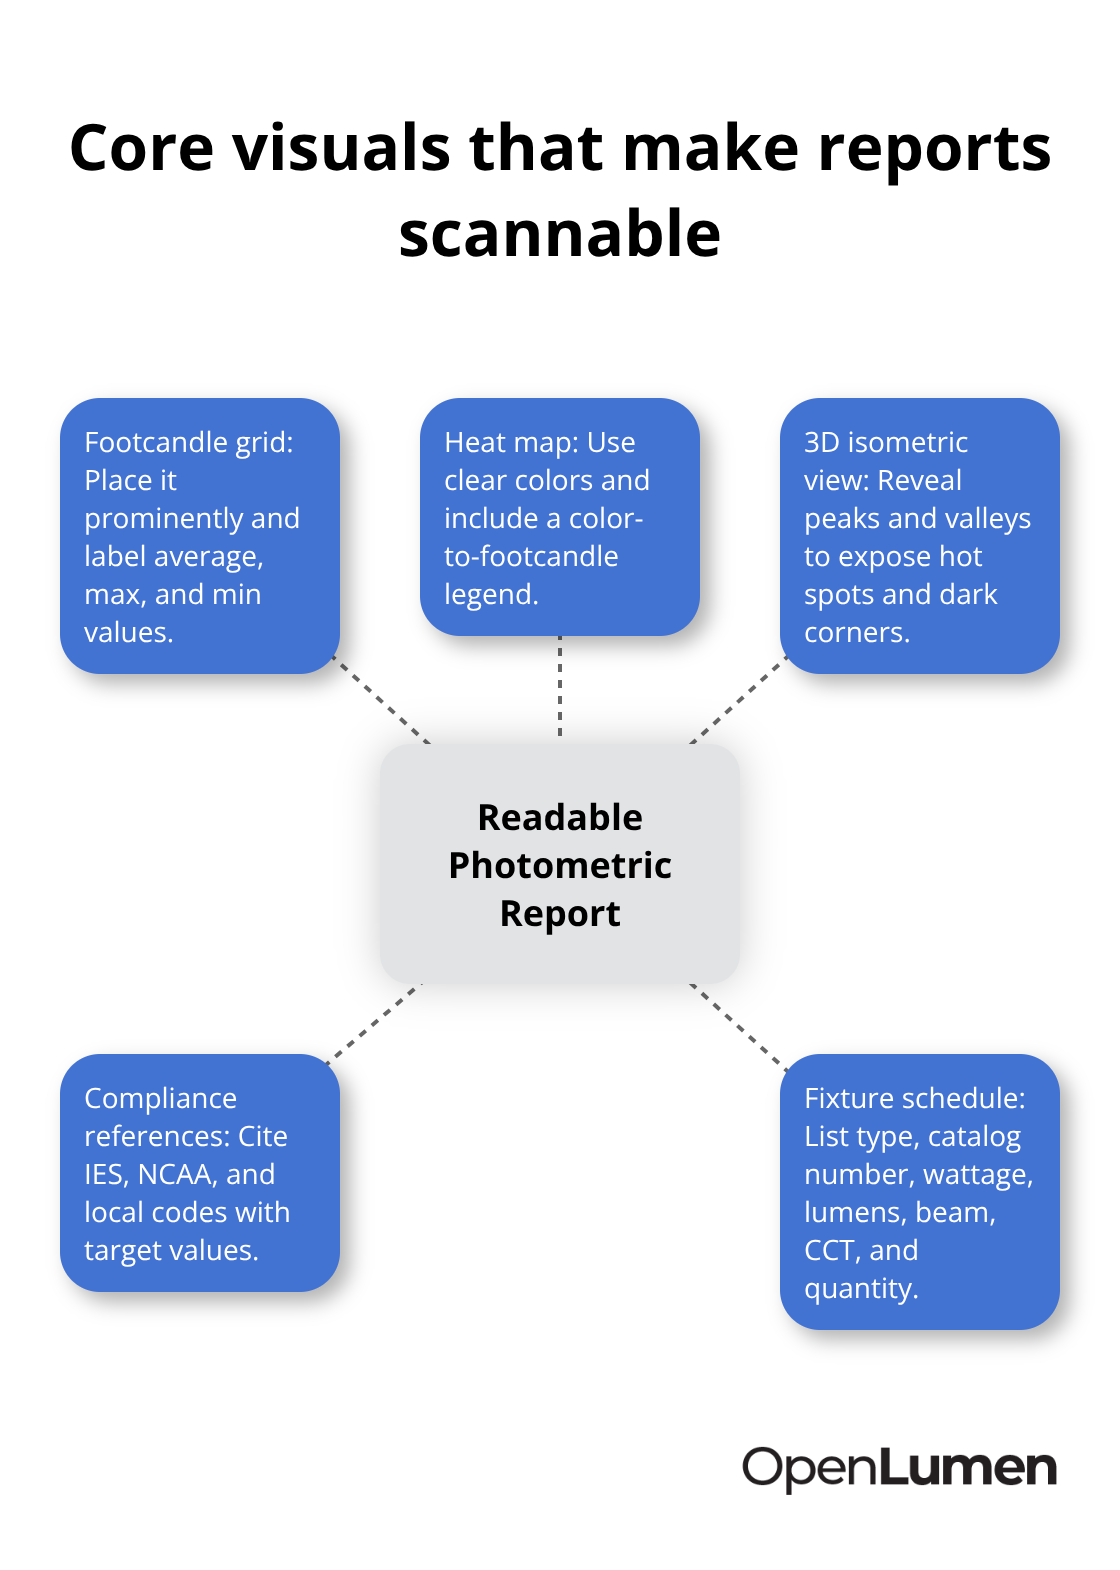
The footcandle grid determines whether stakeholders trust your design or question it. Position the grid prominently on your layout-not as an afterthought on page five. The grid shows calculated illuminance at regular intervals across the space, typically spaced no greater than one-fifth of the mounting height per IES guidance. For a parking lot with 20-foot poles, calculation points should fall roughly every 4 feet. This density reveals hotspots and dark zones that a coarser grid would miss. Label the grid with actual footcandle values at each point, then highlight the average maintained illuminance, maximum value, and minimum value in a summary box. A warehouse aisle might show 28 fc average, 35 fc maximum, and 22 fc minimum-numbers a facility manager can immediately compare against their 30 fc target. Uniformity ratios matter, but state them plainly: if your design achieves 4.2:1 uniformity, explain that the light distributes evenly with only a 4.2-to-1 ratio between brightest and darkest areas, meeting the commercial standard.
Use Heat Maps and 3D Views to Show Coverage Instantly
Pseudo-color heat maps accelerate decision-making because humans process visual information faster than tables. A heat map using blue for dim zones, green for adequate light, and red for bright areas lets a property owner scan the entire space in seconds and spot coverage gaps. Include the color-to-footcandle legend directly on the map so confusion never arises. The 3D isometric view reinforces the heat map by showing light intensity as height; peaks reveal hotspots and valleys expose dark corners that need attention. Provide both because different stakeholders absorb information differently-some prefer the heat map, others the 3D perspective.
Create an Unambiguous Equipment Schedule
A fixture schedule as a simple table with columns for fixture type, catalog number, wattage, lumen output, beam angle, color temperature, and quantity prevents installation errors. Avoid abbreviations unless standard in your industry; spell out LED, color temperature in Kelvin, and beam spread in degrees. A contractor pulling this table should never have to guess what fixture goes where. Include mounting height and aiming angle information directly on the plan layout itself, not in separate notes-place these details near each fixture symbol so installation crews see them instantly. When a design shows 12 Type II fixtures at 18 feet mounted straight down and 8 Type IV fixtures at 15 feet tilted 20 degrees outward, crews execute without ambiguity.
Ground Your Report in Standards and Real-World Performance
State the specific codes and guidelines you met. If you designed to IES RP-8 for roadway lighting or NCAA standards for a tennis court, cite those references with the target values. Include the light loss factor you applied-0.75 for a typical outdoor LED installation accounts for dirt and lumen depreciation over time-so stakeholders understand that your maintained illuminance figure reflects realistic, long-term performance, not idealized new-fixture conditions. Missing this detail leaves stakeholders believing the space will be brighter than it actually becomes after six months of operation, destroying confidence when reality diverges from the report.
The next step involves translating these technical elements into a narrative that guides stakeholders through approval and into procurement.
What Ruins Photometric Reports and How to Fix It
Overcomplicated Visuals That Obscure Rather Than Clarify
The most common mistake is stuffing reports with visualizations that sound impressive but confuse rather than clarify. Contractors and property managers receive polar plots, candela distribution tables, and isolines stacked on top of each other with minimal explanation, then abandon the report entirely because they cannot extract actionable information. The fix is brutal simplicity: include only the visuals that answer the stakeholder’s actual question. A property owner does not need a polar plot showing how light spreads from the fixture at every angle; they need a heat map showing footcandle levels across their parking lot. A facility manager does not need zonal lumen summaries; they need the average maintained illuminance compared directly to their code requirement.
Start with the footcandle grid and heat map, add a 3D isometric view if the space is complex, then stop. Every additional chart must justify itself by answering a specific compliance question or installation detail. Many reports fail because they prioritize technical completeness over stakeholder clarity, treating the document as proof of engineering rigor rather than a communication tool.
Missing or Vague Compliance Documentation
The second failure point is missing or vague compliance documentation. Inspectors and permit offices increasingly demand proof that your design meets applicable standards, yet many reports state illuminance values without naming the standard they reference. A parking lot might show 3.2 fc average, but without stating that IES standards for open parking lots target 1–5 fc, the inspector has no baseline for approval.
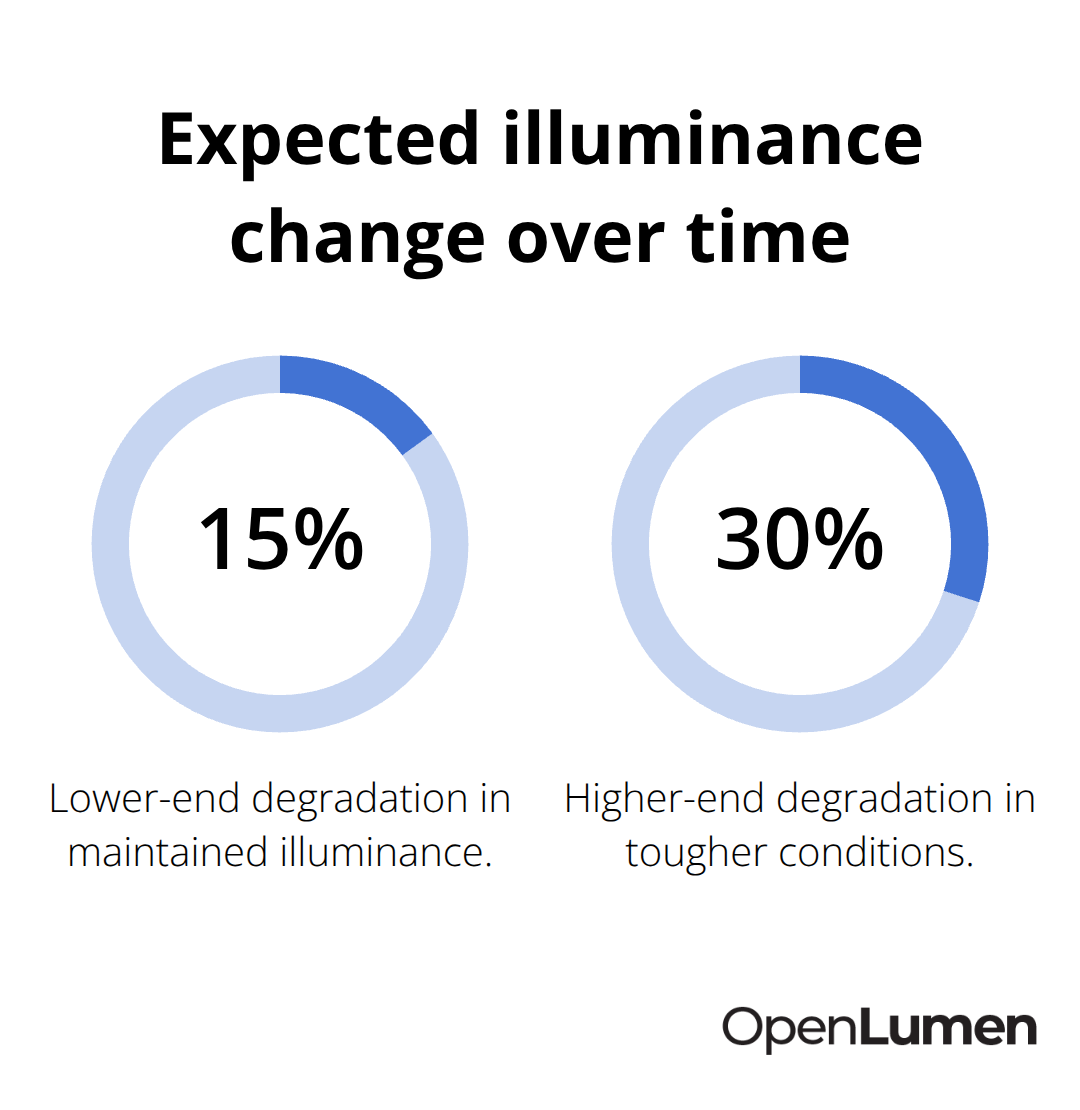
Worse, reports often omit the light loss factor entirely or state it casually in a footnote, leaving stakeholders believing the space will remain at initial brightness indefinitely. Real-world performance degrades 15 to 30 percent over time depending on environmental conditions and fixture maintenance; if you do not account for this in your maintained illuminance calculation, your design promises performance it cannot deliver.
State the specific codes and guidelines you met. If you designed to IES RP-8 for roadway lighting or NCAA standards for a tennis court, cite those references with the target values. Include the light loss factor you applied-0.75 for a typical outdoor LED installation accounts for dirt and lumen depreciation over time-so stakeholders understand that your maintained illuminance figure reflects realistic, long-term performance.
Vague Equipment Specifications and Missing Installation Details
Equipment specifications create the third major problem: vague fixture lists and missing mounting details force contractors to make assumptions on site. A schedule that says twelve LED fixtures without catalog numbers, wattage, or beam angles leaves crews guessing which product to install. Include mounting height, aiming angle, and exact fixture position on the layout plan itself, not buried in separate documents or spreadsheets.
A fixture schedule as a simple table with columns for fixture type, catalog number, wattage, lumen output, beam angle, color temperature, and quantity prevents installation errors. Spell out LED, color temperature in Kelvin, and beam spread in degrees. A contractor pulling this table should never have to guess what fixture goes where. When contractors must cross-reference three different documents to understand what fixture goes where, installation errors multiply and timelines extend.
Building a Unified, Scannable Report
The solution is one unified, scannable report where every number ties directly to a standard, every fixture carries its full specification, and every visual serves a clear purpose for the person reading it. Place the footcandle grid prominently on your layout-not as an afterthought on page five. Label the grid with actual footcandle values at each point, then highlight the average maintained illuminance, maximum value, and minimum value in a summary box. A warehouse aisle might show 28 fc average, 35 fc maximum, and 22 fc minimum-numbers a facility manager can immediately compare against their 30 fc target. Pseudo-color heat maps accelerate decision-making because humans process visual information faster than tables. A heat map using blue for dim zones, green for adequate light, and red for bright areas lets a property owner scan the entire space in seconds and spot coverage gaps.
Final Thoughts
Clear photometric reporting transforms how teams execute lighting projects. Stakeholders move from confusion to confidence, inspectors approve layouts without delays, and contractors install the right equipment the first time when footcandle grids, heat maps, fixture schedules, and explicit standards references work together. Projects that start with transparent deliverables finish on schedule and within budget because property owners trust designs they can verify, facility managers understand what they’re paying for, and installation crews execute without guessing.
Standardized documentation practices benefit everyone in the supply chain. When designers, contractors, and distributors speak the same language through consistent reporting photometric layouts, friction disappears-a fixture schedule with catalog numbers means the same thing to every reader, a light loss factor of 0.75 tells everyone that maintained illuminance reflects real-world conditions after six months, and a reference to IES standards grounds the design in objective requirements rather than opinion. Stop treating photometric reports as proof of engineering expertise and start treating them as communication tools that include only visuals answering stakeholder questions, state every compliance reference explicitly, and specify every fixture completely.
OpenLumen streamlines this process by generating professional photometric layouts and reports directly from verified luminaire data, eliminating friction between design and delivery. When reporting photometric layouts becomes fast and standardized, teams spend less time explaining and more time building, and that’s when lighting projects succeed.
The information provided is for general educational purposes only and should not be considered professional engineering or lighting design advice. Always verify project requirements, local codes, and specifications with qualified professionals before making final decisions.