Lighting designs that look perfect on screen often fail in the real world. Real-time photometry checks catch these errors before you install a single fixture, saving weeks of rework and thousands in costs.
At OpenLumen, we’ve seen too many projects derailed by designs that didn’t account for actual light distribution, glare, or code requirements. Running photometry validation during design-not after-is the difference between confident projects and expensive surprises.
Why Real-Time Photometry Checks Stop Projects From Failing
Design Errors Reveal Themselves at Installation
Design errors in lighting don’t announce themselves politely. They appear on installation day when a warehouse floor is darker than promised, when a parking lot fails its dark-sky audit, or when a client refuses to pay because the brightness doesn’t match the proposal. Photometry checks during design catch these failures while you still control the outcome.
Most contractors skip this step because they assume their fixture selection is correct, but fixture selection and actual light distribution are two different things. A 150-watt LED fixture with good specifications can still deliver uneven light across a space, create dead zones, or exceed local codes for light spill.
Validation Catches Problems Before They Cost Money
Running photometry validation before ordering inventory means you verify footcandle levels, uniformity ratios, and compliance in a simulation where changes cost nothing. A typical warehouse retrofit that discovers lighting problems after installation costs $5,000 to $15,000 in rework, labor, and downtime. Outdoor projects face even steeper penalties-parking lots and sports facilities that fail code inspections require fixture repositioning or replacement, which often means dismantling already-installed poles and wiring.
The financial impact extends beyond labor. Building codes increasingly demand photometric documentation before permits are issued, particularly for commercial spaces and outdoor areas where dark-sky compliance or IES uniformity standards apply. A photometric study with foot-candle grids and uniformity ratios proves your design meets these requirements before construction starts.
Clients Trust Data, Not Promises
Clients also expect this validation. When you show a property owner a photometric report with isoline diagrams showing exactly where light will land and at what intensity, they trust your proposal because they see the data, not just your word. This confidence translates to faster approvals, fewer change orders, and projects that stay on schedule.
The alternative-installing fixtures and hoping they work-is how projects become liability cases and reputation damage. Photometry checks transform your design process from guesswork into a documented, verifiable workflow that protects both your credibility and your bottom line. Understanding how to run these checks effectively requires knowing which tools and standards to apply.
How to Run Photometry Checks in Your Design Workflow
Start With Accurate Manufacturer IES Data
Accurate manufacturer IES data forms the foundation of every photometry check. This is non-negotiable. Generic or outdated IES files produce meaningless results that give false confidence in your design. When evaluating contractor proposals or software tools, require that photometry validation uses the exact fixture model and current IES data from the manufacturer, not approximations. Many designers skip this step and wonder why their simulations don’t match real-world performance.
The IES LM-63 file contains the actual light distribution curve for each fixture, so using the wrong file invalidates your entire analysis. You cannot recover from bad input data-garbage in, garbage out. Verify the fixture catalog number, wattage, and lumen output match between your specification and the IES file before you run any simulation.
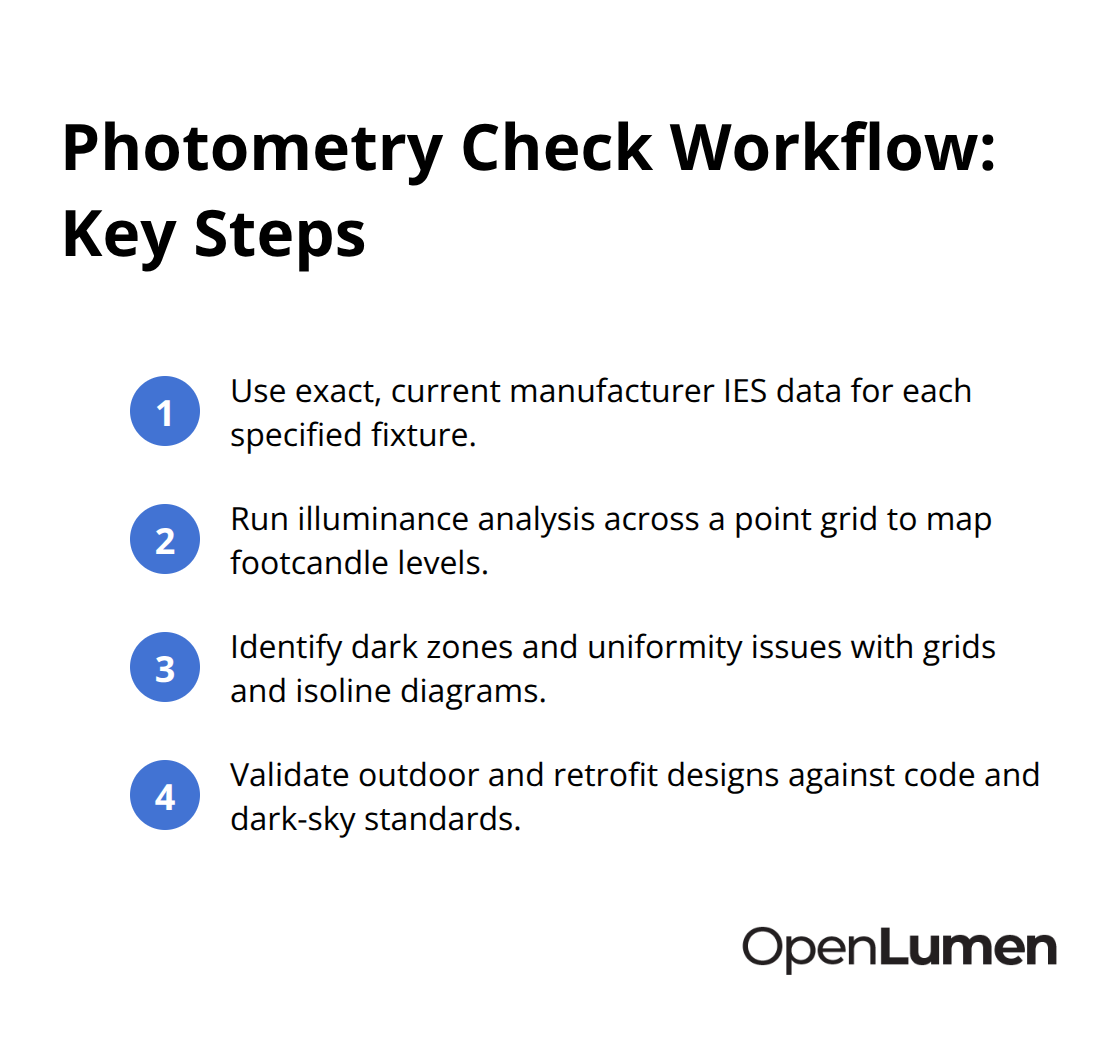
Run Illuminance Analysis Across Your Space
Once you have correct data, run illuminance analysis across a grid of points throughout your space. This simulation calculates footcandle levels at hundreds or thousands of locations, showing you exactly where light lands and how bright it is. For warehouses, try for uniform coverage with a 4:1 uniformity ratio or better-meaning the brightest spot is no more than four times brighter than the dimmest. Sports facilities and outdoor areas often require 3:1 or better.
Parking lots typically need 1 to 5 footcandles across open lots and 5 to 10 footcandles under covered structures, but your local code may differ. Pull your specific requirements from IES recommendations and your building code before running the analysis. This step prevents you from designing to the wrong standard.
Identify Dark Zones and Problem Areas
Compare your simulation results against these standards immediately. Look at the footcandle grid in your report and identify dark zones where light falls below code minimums or where uniformity ratios fail. Isoline diagrams make these problems obvious-they show light distribution as contour lines, just like a topographic map, so you spot dead zones and hot spots instantly.
If your analysis reveals a dark corner in a warehouse or inadequate light at the entrance of a parking lot, adjust your fixture layout, mounting height, or aiming angle in the simulation and run the analysis again. This iteration costs nothing during design but saves thousands once construction starts. Each adjustment takes minutes, not weeks.
Validate Outdoor Projects and LED Retrofits
Outdoor projects face additional scrutiny: photometric studies now document light spill and glare to prove compliance with dark-sky regulations and prevent light trespass onto neighboring properties. Many municipalities require this documentation before issuing permits. You cannot skip this step without risking project delays or rejection.
For LED retrofits, run photometry validation even if you’re replacing older HID fixtures with equivalent wattage LEDs-the optics differ significantly, so light distribution changes. A 400-watt metal halide fixture and a 150-watt LED may have similar lumen output, but their beam patterns are completely different. Validation ensures your new design actually meets performance targets instead of creating unexpected shadows or glare that your client didn’t anticipate. This is where many retrofit projects stumble, and where photometry checks prevent costly mistakes before installation begins.
Where Photometry Checks Fail and How to Fix Them
Fixture Spacing Does Not Equal Even Light
Most contractors assume that spacing fixtures evenly across a space produces even light. It does not. A warehouse with fixtures spaced 20 feet apart on a grid might deliver 50 footcandles under one fixture and 15 footcandles in the gaps between them, creating a 3:1 ratio that fails most commercial standards. Light distribution depends on mounting height, beam angle, and aiming direction-not just fixture count.
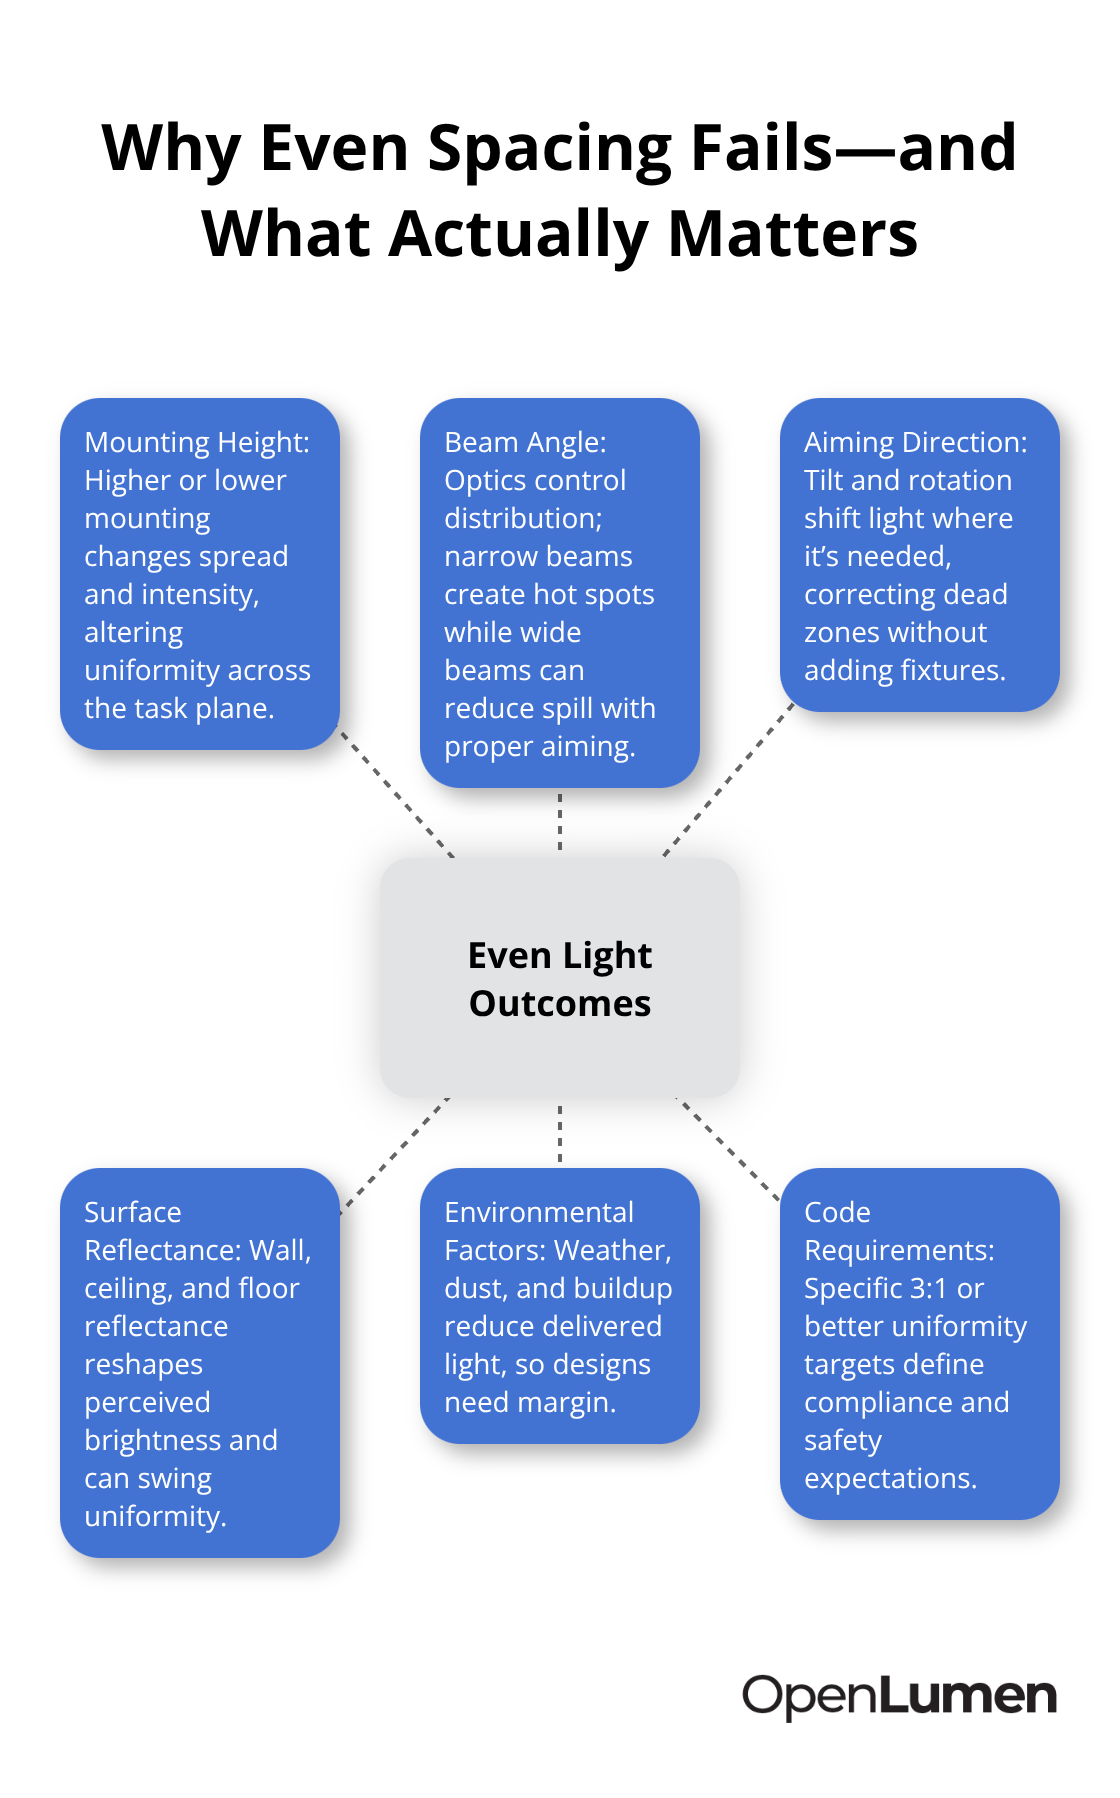
When you run your photometry check, calculate footcandle levels at actual working heights (typically 30 inches above the floor for task areas, ground level for parking lots) and compare uniformity ratios against your specific code requirement, not a generic benchmark. Many contractors reference a 4:1 ratio as acceptable, but IES recommendations and local codes often demand 3:1 or better for retail, sports facilities, and warehouses where visibility directly impacts safety and product display. If your simulation shows 4:1 uniformity but your code requires 3:1, you catch this during design and adjust your fixture layout before ordering inventory. Ignoring this mismatch guarantees a failed inspection and costly rework.
Glare and Light Spill Demand Real Validation
Outdoor projects especially suffer when designers treat glare and light spill as afterthoughts. A parking lot that meets footcandle targets but throws light across neighboring properties violates dark-sky ordinances in most municipalities, risking permit rejection or legal liability. Your photometry validation must include light trespass analysis showing how much light spills beyond your property boundary; if your local code restricts light spill to 0.1 foot-candles at the boundary (common in residential areas), your simulation must prove compliance by calculating illuminance at that exact distance.
Similarly, LED retrofits fail because designers assume a 150-watt LED replacing a 400-watt metal halide delivers proportional light reduction. The optics differ drastically. The LED’s narrower beam might concentrate light in a smaller area, creating hot spots and dark zones that the old fixture never produced. Run photometry validation on the retrofit design and reveal these distribution changes before installation, letting you reposition fixtures or adjust mounting heights to match the original performance your client expects.
Reflectance Values Shape Your Real Results
Real-world conditions amplify these errors further. Reflectance values in your space-wall color, floor material, ceiling finish-significantly affect actual light distribution, yet many simulations use default reflectance percentages (typically 50% for walls, 20% for floors) that do not match your specific site. A warehouse with white painted walls reflects far more light than one with dark concrete, shifting your uniformity ratio by 0.5 to 1.0 foot-candles across the space.
Your photometry tool should let you input actual reflectance values from material samples or manufacturer specs. If it does not, your results underestimate performance in bright spaces and overestimate it in dark ones. This mismatch between simulation and reality creates the biggest surprises on installation day.
Environmental Factors Degrade Performance Over Time
Outdoor areas add weather variability that most designs ignore. Rain, dust, and seasonal foliage near fixtures reduce light transmission by 5 to 15 percent, meaning a design that barely meets code in clear conditions fails during winter or after a dust storm. Account for this degradation factor in your simulation by reducing lumen output by 10 percent and rerunning the analysis to confirm the design still complies.
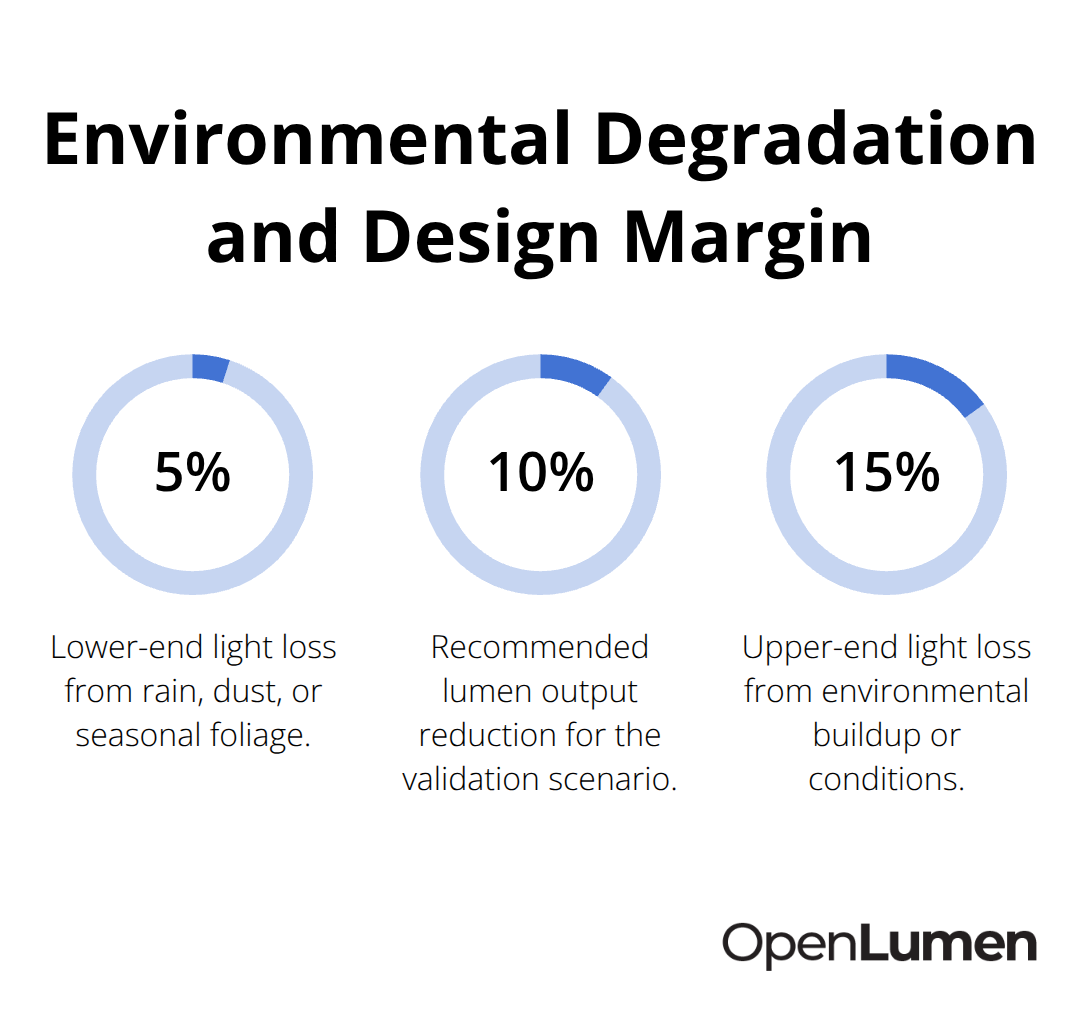
Use your photometry tool to test this scenario immediately. If your design passes with a 10 percent reduction, you have confidence that seasonal changes and maintenance intervals will not create compliance problems. If it fails, adjust your fixture layout or upgrade to higher-output luminaires before you commit to the installation plan.
Conclusion
Real-time photometry checks transform lighting design from guesswork into a documented, verifiable process that protects your reputation and budget. Adjusting fixture layout, mounting height, or aiming angle in a simulation takes minutes, while making the same changes after installation takes days and costs money you’ll never recover. Your photometry validation catches errors while changes remain free, letting you iterate quickly toward a design that actually works.
Real-time photometry checks also give you data to show clients and inspectors. A footcandle grid and uniformity report prove your design meets code requirements before construction starts, accelerating permit approvals and eliminating change orders. This documentation builds trust with property owners who see exactly what they’re paying for instead of relying on promises alone.
OpenLumen is a free, browser-based platform that lets you create photometric layouts, run illuminance analysis, and generate professional reports without expensive software licenses or specialized training. Its community-verified luminaires library and instant metrics streamline your entire design-to-install workflow, so you validate faster and move projects forward with confidence.
The information provided is for general educational purposes only and should not be considered professional engineering or lighting design advice. Always verify project requirements, local codes, and specifications with qualified professionals before making final decisions.