Photometric layout reporting basics matter more than most contractors realize. A solid report tells clients exactly what light levels they’ll get, where coverage gaps exist, and whether the design meets code-without confusion or guesswork.
At OpenLumen, we’ve seen proposals rejected or delayed because the photometric data was either buried in technical noise or missing critical details. This guide walks you through what to include, how to present it clearly, and the mistakes that cost you credibility with clients.
What Photometric Reports Must Include
A photometric report that closes deals contains three non-negotiable components: actual light levels at the work plane, how evenly that light spreads across the space, and exact fixture details so the client knows what they’re paying for. Most contractors bury these details in dense tables or skip them entirely, which stalls proposals.
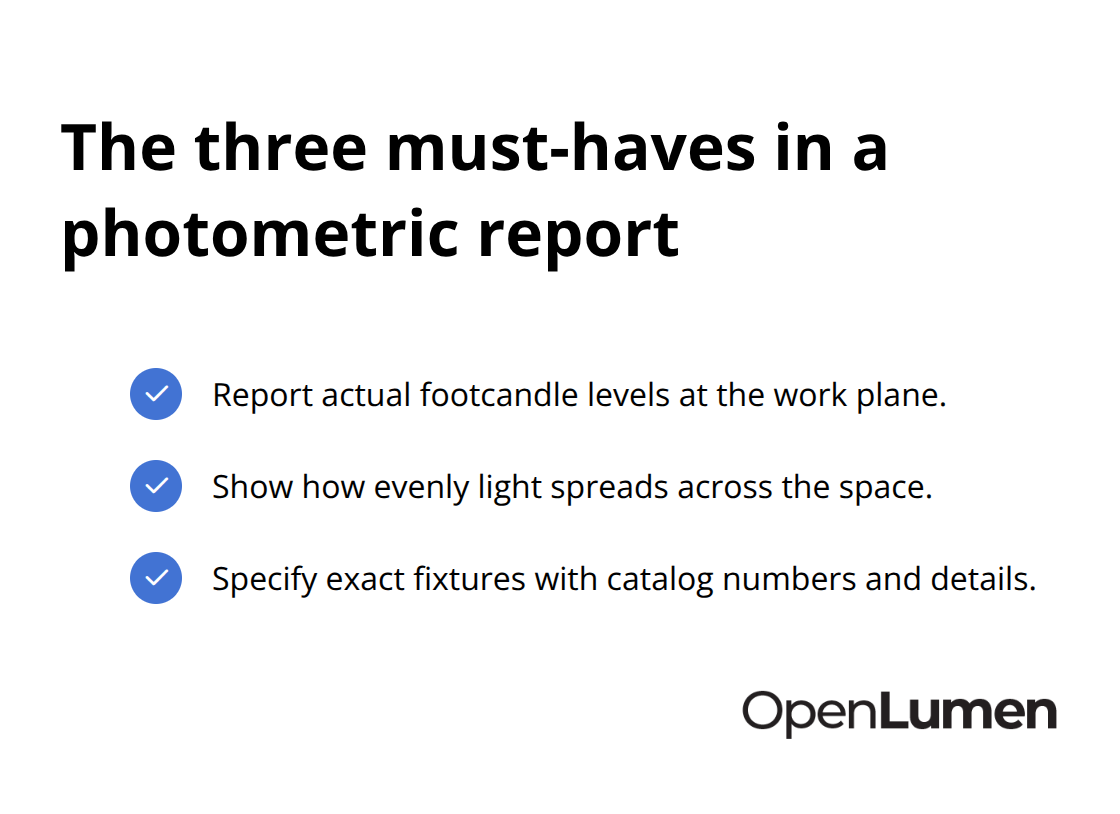
Your report must answer three questions every client asks: Will my space meet code? Will the light spread evenly? What fixtures am I actually buying?
Footcandle Levels and Coverage
Footcandle levels tell the client whether their parking lot, warehouse, or sports facility will meet code. Open parking lots typically need 1 to 5 footcandles, while covered areas require 5 to 10, per IES guidance. Show these numbers on a grid map so the client sees dark spots immediately. Include a footcandle plan view that visualizes the entire space with isolines-those contour lines showing where light intensity drops off. This single view answers whether the space will be bright enough and even.
Uniformity Ratios That Matter
Uniformity ratios compare the brightest point to the dimmest point in your layout. Try for a 4:1 ratio or better for most commercial spaces; sports facilities often demand 3:1 or tighter. Clients care because uneven lighting looks cheap and creates safety gaps. A clear uniformity number in your report removes doubt about whether the design will work.
Luminaire Schedule and Fixture Details
Your luminaire schedule is where credibility lives. List every fixture by exact catalog number, wattage, lumen output, beam angle, color temperature, and quantity. Never use generic fixture data or substitutes; pull IES LM-63 files directly from the manufacturer for the exact model you’re quoting. A client comparing two proposals will spot when one uses real data and the other doesn’t. Include fixture layout details showing mounting heights, pole locations for outdoor projects, and aiming angles so your installation crew doesn’t guess on site.
Visual Presentations That Communicate
Add a 3D isometric view or pseudo-color heat map if the space is complex-these visuals help non-technical stakeholders understand light distribution without reading numbers. If dark sky compliance matters, model uplight and light trespass to show the client you’ll hit boundary limits (often around 0.1 footcandles at property lines). The report should run 5 to 20 pages depending on complexity, but every page must answer a specific question the client or inspector will ask.
Vague reports cost you jobs. Detailed, accurate reports with real fixture data and clear visuals move clients toward approval-which is why the next step focuses on how you present this information to different stakeholders.
How to Present Photometric Data So Clients Actually Understand It
Most contractors show clients the same report regardless of who reads it-a mistake that kills proposals. A facilities manager cares about energy costs and maintenance headaches; a building inspector needs code compliance proof; a CFO wants ROI numbers. We see proposals rejected because the data exists but speaks to nobody. The fix is simple: select metrics that answer each stakeholder’s specific question, present those metrics in formats they can grasp in seconds, and strip away everything else.
Pick Metrics That Match the Decision-Maker
A facilities manager at a warehouse won’t care about polar charts or candela values-they want to know average footcandles across the work plane and whether the retrofit saves energy compared to the old system. Show them the annual kWh reduction and payback timeline. An architect evaluating your design wants to see uniformity ratios and glare potential; give them the max-to-min ratio and NEMA classification data. A municipal inspector reviewing a parking lot for dark sky compliance needs uplight percentage and light trespass at property lines, often targeting 0.1 footcandles or less per dark sky ordinances. Don’t include polar plots or zonal lumen summaries unless the person reading the report specifically asked for them.
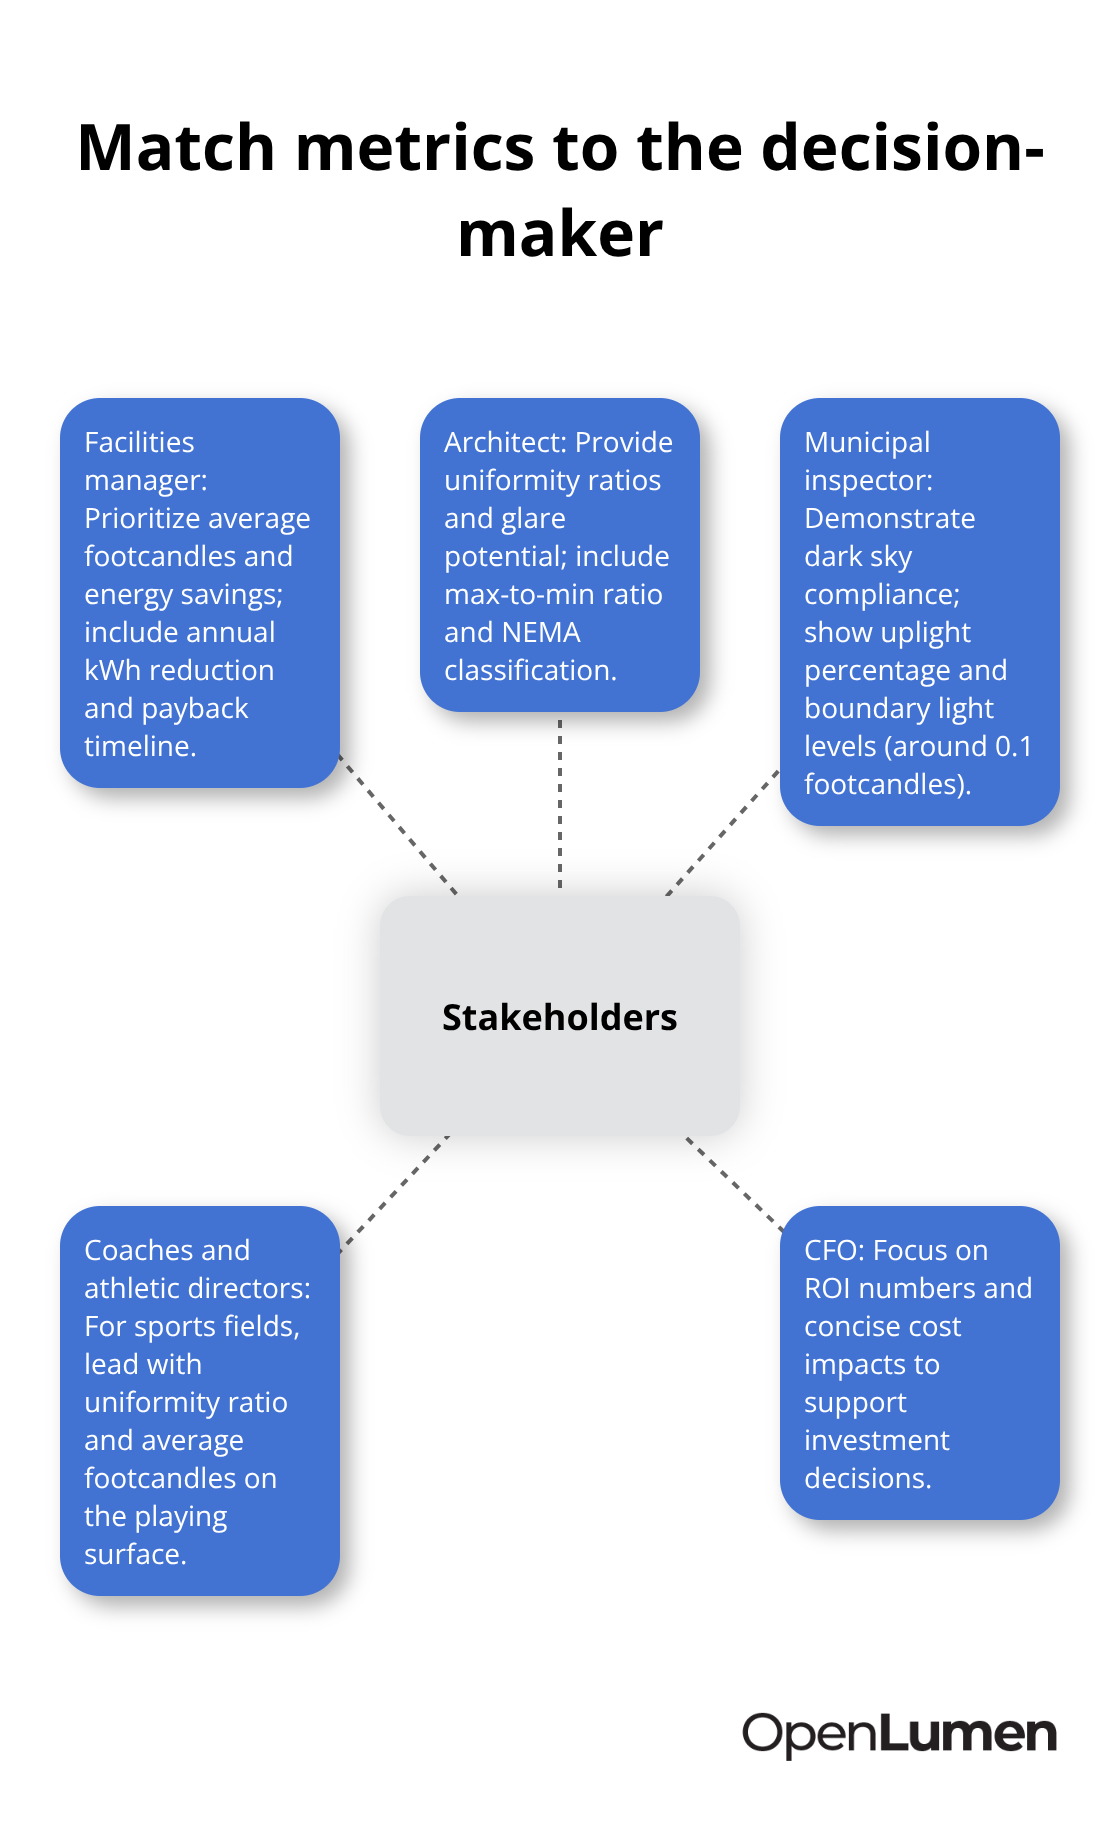
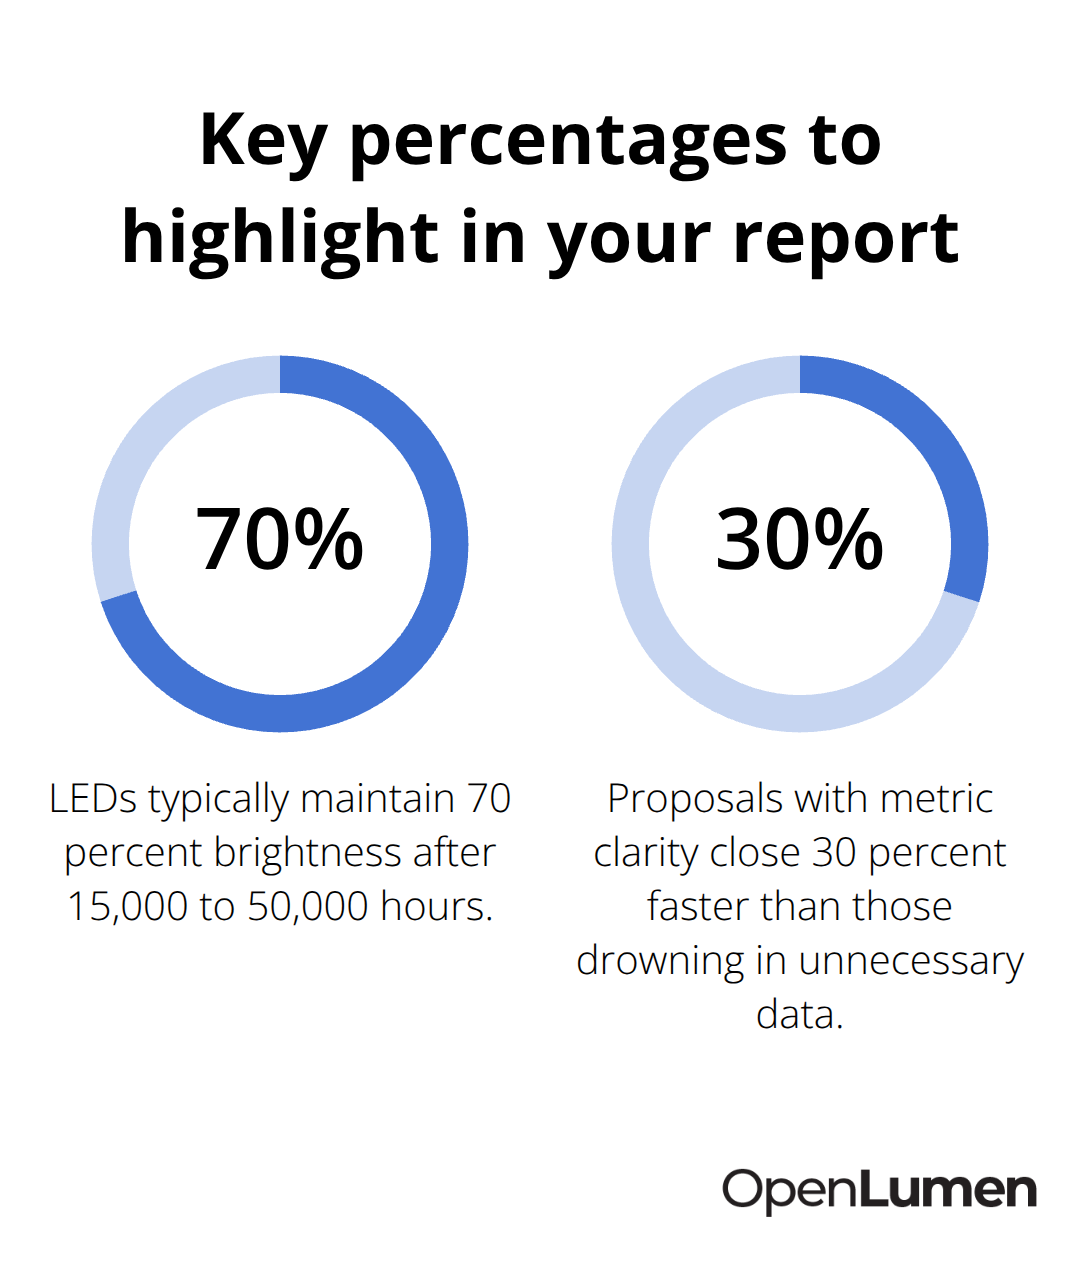
Every metric you add dilutes the ones that matter. For outdoor sports facilities, coaches and athletic directors focus on whether the field meets NCAA or local sport-governing-body standards-so lead with uniformity ratio and average footcandles on the playing surface, then add the technical details below. Proposals with metric clarity close 30 percent faster than those drowning in unnecessary data.
Format Data for Speed and Confidence
A footcandle grid plan view with isolines is non-negotiable-it shows dark spots and even coverage in one glance. Color-coded heat maps work even better; red zones show peak brightness, blue shows dim areas, and the client sees the entire space in seconds without reading a single number. For complex indoor spaces like manufacturing facilities, add a 3D isometric view so the client visualizes actual fixture placement and mounting height. Tables with rows of numbers fail; most clients skim them and miss critical information. Instead, highlight the three numbers that matter: average footcandles, min-to-max ratio, and compliance status (pass or fail against code). Place these at the top of the report in large type. If you propose an LED retrofit, show a before-and-after footcandle comparison side by side-this visual proof that the new design meets or beats the old system closes objections instantly. For proposals competing against other vendors, include a one-page summary sheet that a busy decision-maker can scan in two minutes; if they want detail, they’ll read into the full report.
Tailor Depth and Language to Your Audience
A contractor’s internal crew needs exact pole locations, mounting heights, and aiming angles-technical precision matters because they’ll install it. A client proposal should strip out jargon and explain what numbers mean in plain terms: say the design achieves 0.8 uniformity instead of using the phrase 4:1 ratio, then explain in one sentence that this means light spreads evenly with no dark patches. Energy consultants and sustainability officers want lumens-per-watt efficiency and lumen depreciation data (LEDs typically maintain 70 percent brightness after 15,000 to 50,000 hours); include this if it affects long-term cost.
For retail or hospitality clients, add color temperature and CRI data because these affect mood and merchandise appearance, but explain it simply: 4000K feels neutral and professional, while 3000K feels warm and welcoming. Never assume the reader knows what footcandles are; spend one sentence defining it as brightness at floor level. A five-page report for a small parking lot retrofit looks thorough; a five-page report for a single-room office looks bloated and unprofessional. Scale report length to project complexity. Most clients won’t read past page three, so put your strongest evidence-the footcandle grid, uniformity ratio, and compliance confirmation-on pages one and two.
The next step is knowing which mistakes to avoid when you build these reports. Common errors in photometric reporting cost contractors credibility and delay approvals-and they’re all preventable.
Common Mistakes in Photometric Reporting
Three preventable errors appear in nearly every rejected proposal. The first is overwhelming clients with unnecessary technical output. Contractors produce reports with polar charts, candela distributions, zonal lumen summaries, and coefficient of utilization tables when the client only needs footcandles and uniformity. A 20-page report with 15 pages of unused data signals that you don’t understand your client’s needs or that you’re hiding something. Strip it down ruthlessly. A parking lot retrofit needs a footcandle grid, uniformity ratio, and luminaire schedule-nothing else. If the client requests polar plots or advanced metrics, provide them as an appendix, not the main narrative.
Validate Against Code Before Submission
The second critical mistake is skipping code validation entirely. Contractors quote fixtures and layouts without confirming compliance against IES recommendations, AASHTO standards for roadways, NCAA requirements for sports facilities, or local municipal lighting ordinances. A parking lot that meets IES guidance at 3 footcandles average but fails your city’s dark sky ordinance requiring 0.1 footcandles or less at property lines will face rejection after installation. Run the photometric study against every applicable code before the proposal leaves your desk. If it doesn’t pass, redesign immediately rather than hoping the inspector overlooks it. Municipal inspectors compare your submitted photometric data directly against code; mismatches kill credibility and delay projects by months.
Account for Real-World Installation Variables
The third mistake treats the photometric study as a theoretical exercise instead of an installation blueprint. Real-world variables-surface reflectance, actual mounting heights differing from design, fixtures aimed slightly off angle, or nearby structures blocking light-shift performance on site. A study that assumes 80 percent reflectance on a parking lot surface but the actual asphalt is 40 percent reflective delivers significantly lower footcandles than promised. Test the actual site reflectance before designing, or build conservative assumptions into your study and explain them to the client. For indoor warehouses, verify ceiling height and surface conditions match your model; a 25-foot ceiling with dirty white paint behaves differently than a 30-foot ceiling with clean reflective surfaces. Include a brief note in your report acknowledging which real-world factors could shift performance and by how much. This transparency prevents angry calls after installation and positions you as thorough rather than careless.
Present Only Metrics That Matter
Over-reporting confuses decision-makers and buries the information they actually need. A facilities manager at a warehouse wants average footcandles and energy savings, not polar distributions. An architect needs uniformity ratios and glare data. A municipal inspector requires code compliance proof and boundary light levels. Select the three to five metrics that answer each stakeholder’s specific question, then remove everything else. This focused approach moves proposals forward faster than comprehensive technical reports that nobody reads completely.
Final Thoughts
Photometric layout reporting basics rest on three principles: show real data, present it clearly, and validate it against code before submission. A footcandle grid with isolines, a uniformity ratio, and a detailed luminaire schedule answer every question a client or inspector will ask. Confidence flows from precision, and precision comes from reports built on manufacturer IES data and real-world assumptions, not generic estimates.
Start by pulling exact IES LM-63 files from manufacturers for every fixture you quote, never substitutes. Run your photometric study against all applicable codes before the proposal leaves your desk. Select three to five metrics that matter to each decision-maker and present them in formats they can grasp in seconds (footcandle grids work better than tables, and heat maps work better than grids).
Tools like OpenLumen streamline this workflow by letting you generate professional photometric reports with real-time illuminance analysis and community-verified luminaire data without expensive software. The faster you produce accurate reports, the faster you move proposals toward approval and installation. Apply these fundamentals consistently, and you’ll see proposals convert at higher rates and installations proceed without surprises.
The information provided is for general educational purposes only and should not be considered professional engineering or lighting design advice. Always verify project requirements, local codes, and specifications with qualified professionals before making final decisions.