Bad lighting design costs money and frustrates occupants. Uneven illumination, glare, and wasted energy happen when you skip the planning phase.
This photometric layout guide walks you through the entire process-from understanding what matters to validating your final design. At OpenLumen, we’ve seen how the right approach transforms projects from mediocre to exceptional.
What Photometric Layouts Actually Do
A photometric layout is a computer-generated simulation that maps exactly how light fixtures distribute illumination across your space before you buy or install anything. It answers three questions contractors and property owners ask constantly: Will the light reach where it needs to go? Will it be even, or will some areas stay dark? How much energy will this actually consume? Without this simulation, you’re guessing-and guessing wrong costs money.
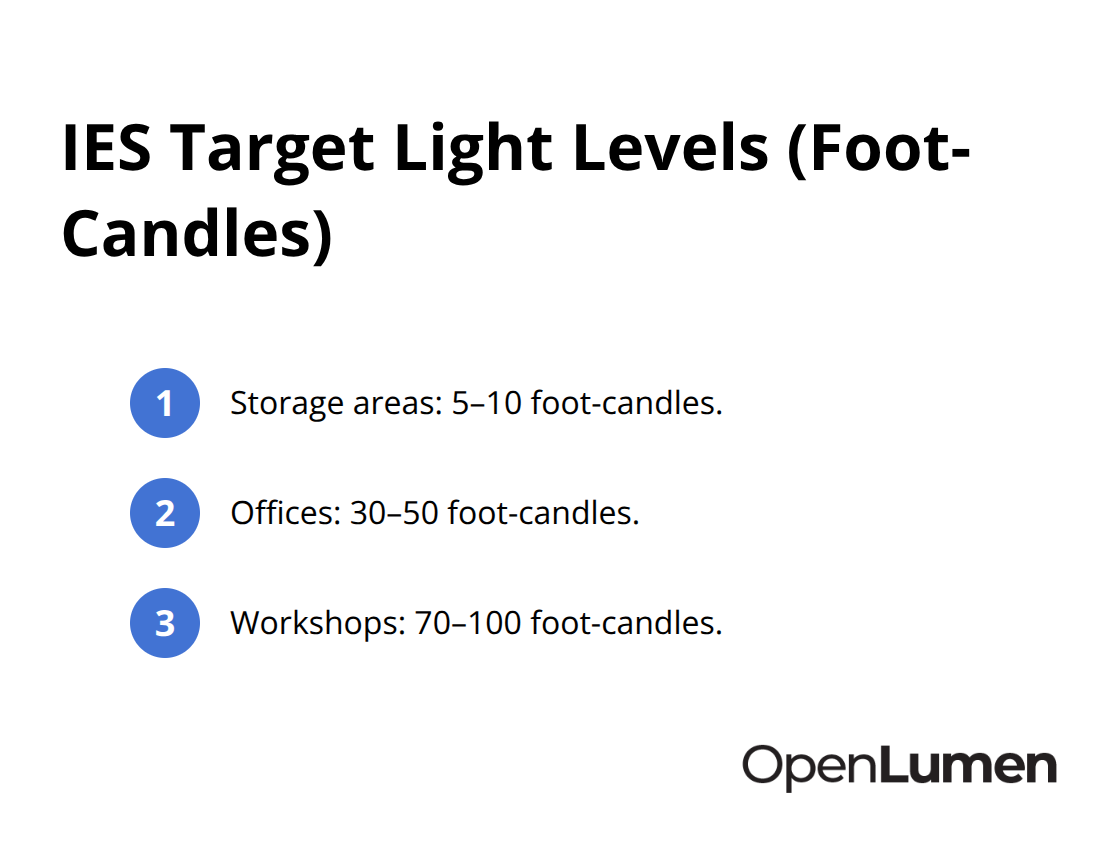
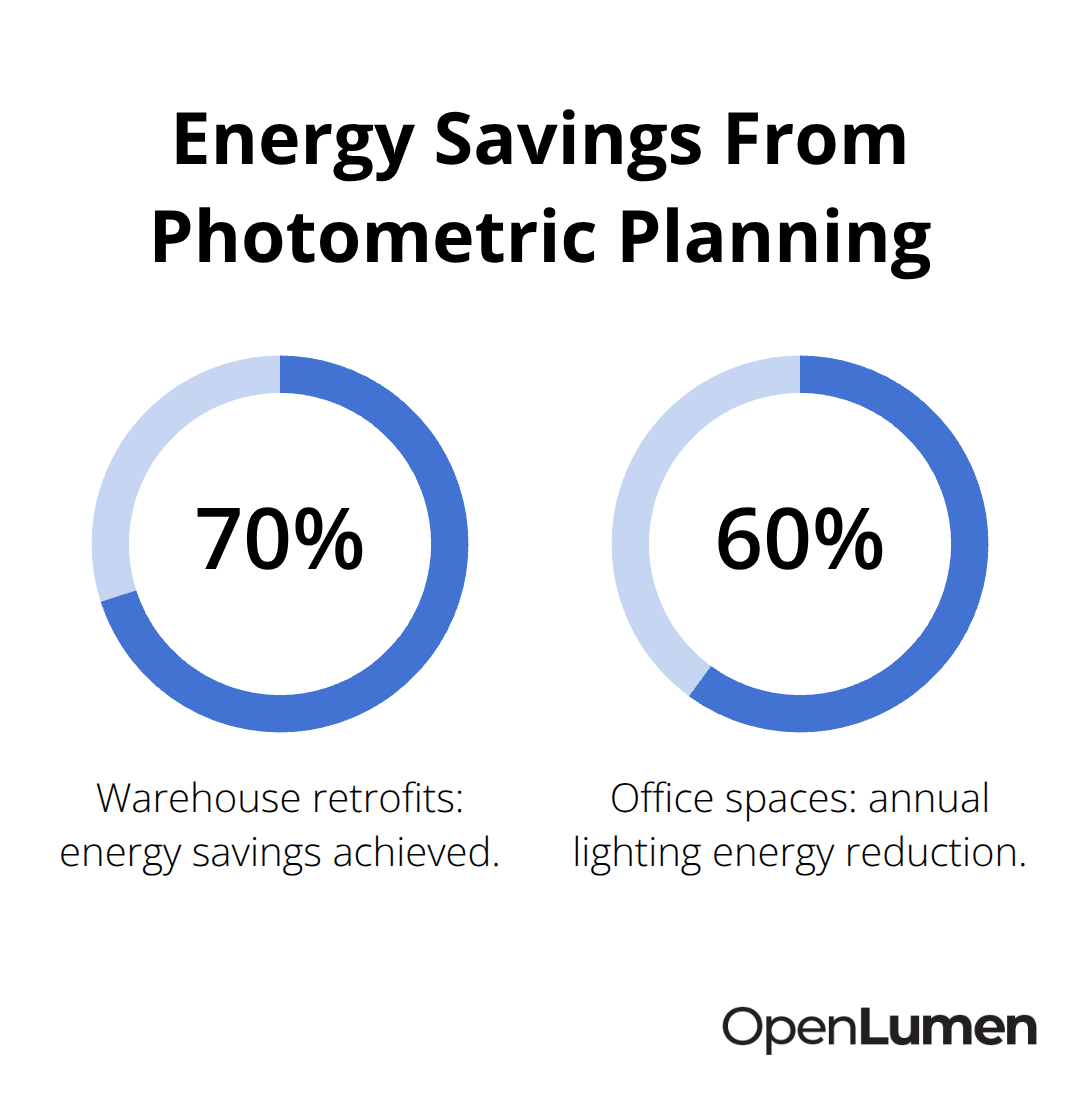
The Illuminating Engineering Society publishes recommendations for light levels across different space types: storage areas need 5–10 foot-candles, offices need 30–50, and workshops need 70–100. A photometric layout verifies your fixture selection hits these targets before installation, eliminating the costly redesigns that happen when reality doesn’t match expectations. This is why projects like warehouse retrofits from 450W metal halide to 120W LED high bays deliver around 70% energy savings-the photometric plan guided the fixture selection and spacing to work with LED’s directional optics instead of fighting them.
Uniformity stops wasted energy and eye strain
Uniformity measures how evenly light spreads across your space, expressed as a ratio between average and minimum illuminance levels. Try for 0.6–0.8 in most applications; anything lower creates bright spots next to dark zones, forcing your eyes to constantly readjust and burning energy on fixtures that overcompensate in weak areas. A photometric layout calculates this ratio and shows you exactly where uneven distribution occurs, letting you adjust fixture spacing or beam angles before ordering.
Real installations at IKEA Kaarst and ES IDOM Madrid demonstrate the payoff: daylighting controls paired with photometric planning cut annual lighting energy use from 78.1 kWh per square meter to 41.4, and in one deep office space down to 4.90 kWh per square meter. These results happened because the layout identified where natural light could supplement fixtures, reducing reliance on electrical lighting during daylight hours. Occupancy sensors and dimming controls add another 24–30% savings in commercial spaces when layered on top of a solid photometric foundation, according to the Illuminating Engineering Society research.
Glare and light trespass create liability and compliance issues
Glare reduces visibility and causes eye fatigue, while light trespass-light spilling onto neighboring properties-triggers complaints and municipal violations. A photometric layout includes beam angle and optic distribution analysis that prevents both problems. Your layout software shows spillover patterns and glare potential through pseudo-color plots and isoline visualizations before installation.
This matters for outdoor projects especially: many cities now require photometric documentation proving compliance with dark sky regulations and boundary light limits before permits are issued. Parking lots, for example, typically target 1–5 foot-candles in open areas and 5–10 in covered sections, but the optics you choose determine whether light stays on-site or escapes. A professional photometric report includes a luminaire schedule listing every fixture’s catalog number, wattage, lumen output, beam angle, color temperature, and quantity-the exact data municipal inspectors and contractors need to confirm compliance and coordinate installation.
How photometric layouts guide your next steps
The simulation reveals what works before you commit budget and labor. Once you understand what a photometric layout does-and why uniformity and glare control matter-the next step is assessing your specific space and occupant needs to build an accurate model.
Planning Your Photometric Layout
Start with your space dimensions, ceiling height, and mounting positions-these are non-negotiable inputs. Measure twice; guessing wastes time in the simulation phase. Next, identify what the space actually demands: storage areas operate fine at 5–10 foot-candles according to IES standards, but a workshop or inspection area needs 70–100. If occupants complain about eye strain or productivity drops in dim zones, you’re likely below target. Talk to facility managers about problem areas from past installations-dark corners near walls, glare near windows, or shadowed zones under high equipment. This feedback shapes your fixture selection far more than generic recommendations. Outdoor projects add complexity: parking lots typically need 1–5 foot-candles in open areas and 5–10 in covered sections, but municipal codes increasingly demand specific boundary light limits to prevent trespass. Check your local regulations before modeling; some cities now require dark sky compliance documentation before permits are approved. Document all these requirements in writing so your photometric software reflects real occupant needs, not assumptions.
Choosing fixtures that match your space geometry
Fixture selection determines whether your layout succeeds or fails. LED’s directional optics make this critical: a 450W metal halide high bay and a 120W LED high bay produce vastly different light patterns, so swapping one for the other without photometric analysis guarantees disappointment. Obtain IES LM-63 data files directly from manufacturers for the exact fixture model and optic you’re considering. Beam angle and optic type drive uniformity and spillover, so test multiple options in your simulation before committing. For instance, a 40-degree optic concentrates light tightly and works well for narrow aisles, while a 90-degree spread covers broader areas but may create dark zones at edges.
Don’t rely on lumen output alone; a 10,000-lumen fixture in the wrong optic delivers worse results than a 7,000-lumen fixture with the right beam pattern. Warehouse retrofits that achieved 70% energy savings did so because photometric planning matched LED fixtures to existing ceiling heights and aisle widths, not because the fixtures were simply brighter. Color temperature and CRI matter for task accuracy and worker satisfaction-offices and retail spaces benefit from 3000K–4000K with CRI above 90, while industrial inspection areas may need 5000K for color rendering. Your photometric software lets you swap fixtures in seconds, so test beam angles, lumens, and color temperature combinations until your simulation hits target uniformity (0.6–0.8) and foot-candle levels without over-specifying. This phase saves thousands in material and labor costs downstream.
Spacing and placement rules that actually work
Fixture spacing depends on ceiling height, optic beam angle, and target uniformity. General rule: space fixtures roughly twice the distance from walls to avoid dark perimeter zones. Recessed fixtures typically work best spaced about half the ceiling height apart-a 10-foot ceiling suggests 5-foot spacing-and positioned 3 feet from walls. Wall washing requires 30–45 degree angles with distance roughly equal to 1–1.5 times the wall height. These guidelines form your starting point, but your photometric software refines them based on your specific optics and geometry.
Run the simulation with your proposed layout, then check the calculation grid for average, minimum, and maximum foot-candle values. If minimum values fall short or uniformity ratios exceed 1.2 (indicating uneven distribution), adjust spacing or add fixtures. Outdoor parking lots often need tighter spacing than intuition suggests because LED’s narrow beam angles leave gaps that traditional fixtures would fill. A three-day parking lot retrofit using 120W LED area lights succeeded because the photometric plan optimized pole spacing and fixture count to eliminate dead zones while minimizing spillover. Most software runs these calculations in minutes, so iterate freely.
From simulation to installation blueprint
Once your simulation confirms target light levels and uniformity, export the luminaire schedule showing exact fixture quantities, mounting positions, wattage, and electrical load. This schedule becomes your procurement and installation blueprint, eliminating field surprises. The calculation grid also provides the average, minimum, and maximum foot-candle values across your space, along with zone-based distribution data that verifies building-code compliance. With your fixture layout validated and your luminaire schedule finalized, you’re ready to run real-time illuminance analysis and interpret the photometric data that stakeholders and inspectors will demand.
Validating Your Design Before Installation
Your photometric software has run the simulation and produced numbers. Now comes the part that separates confident projects from disasters: interpreting what those numbers actually mean for your space and your budget. The calculation grid shows average, minimum, and maximum foot-candle values across your layout, but raw numbers tell only half the story.
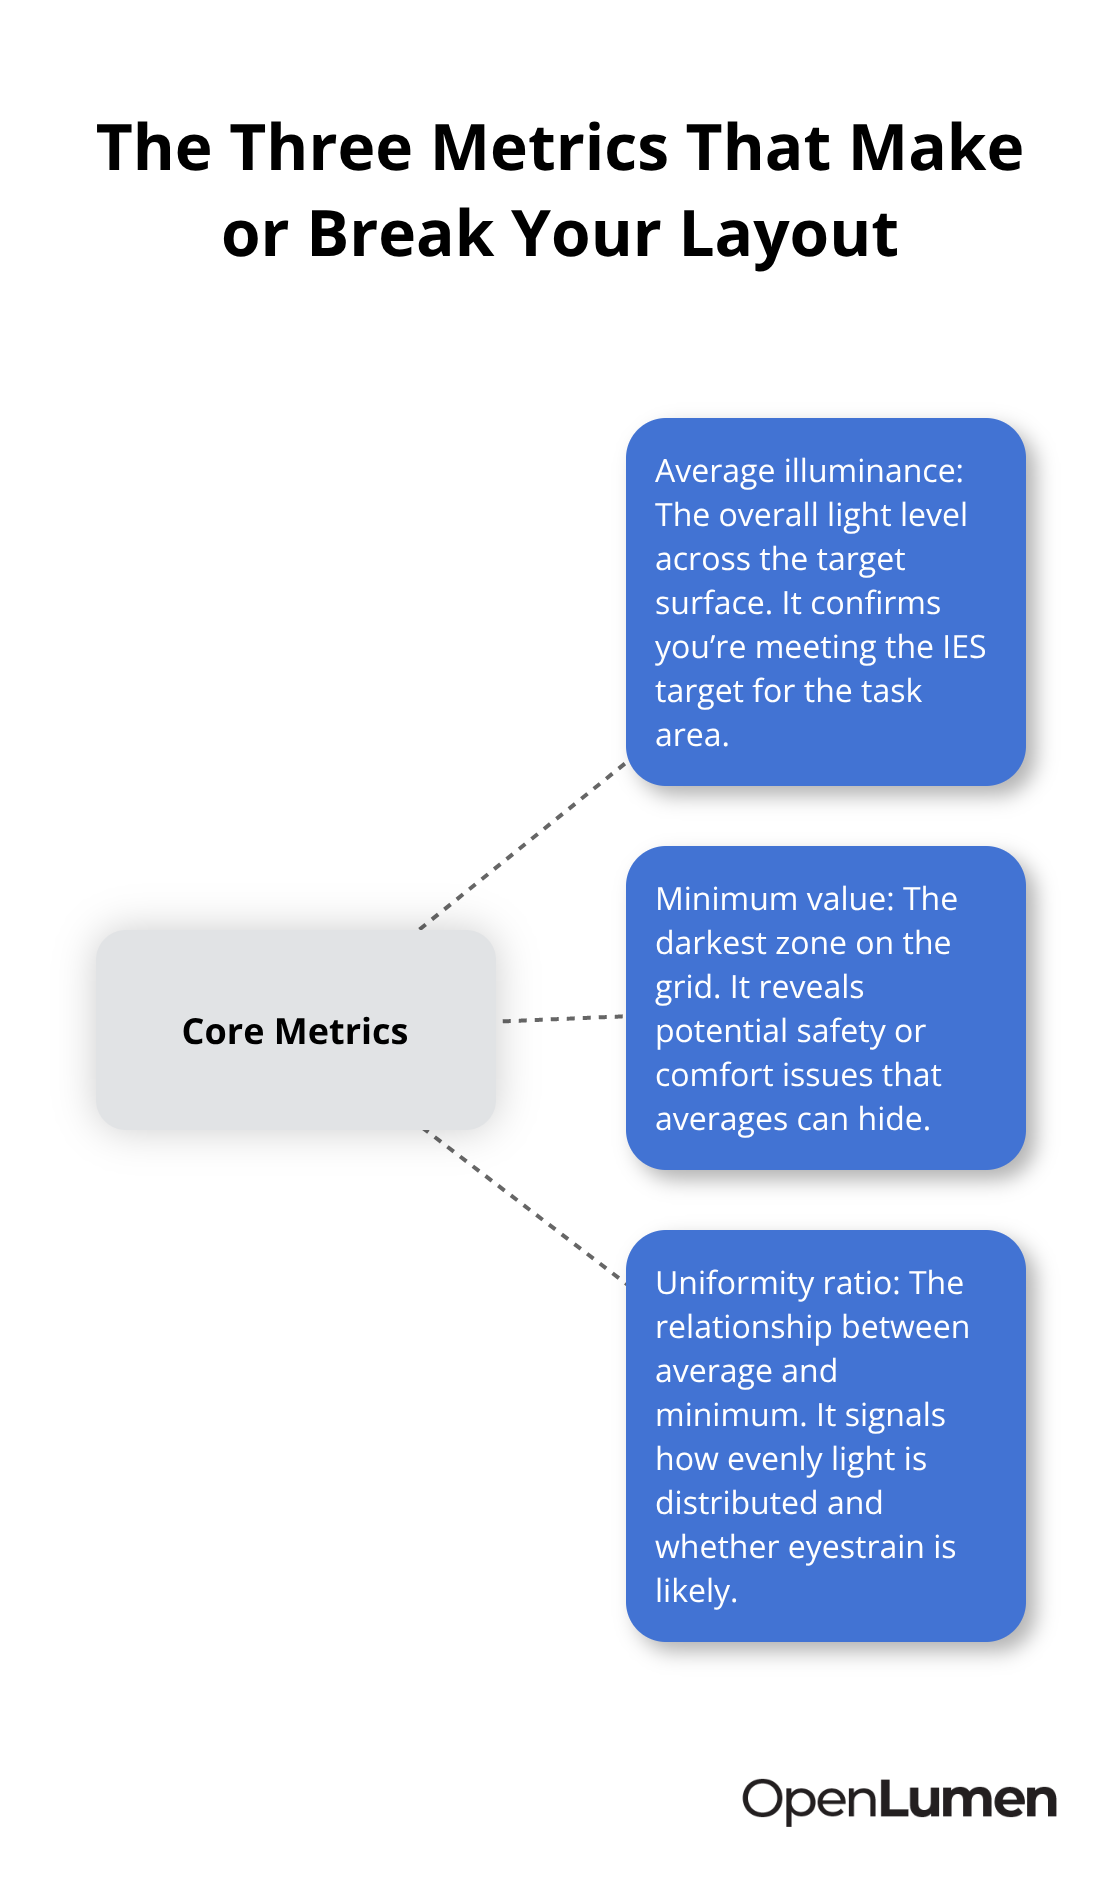
Focus on the three metrics that matter most
Three specific outputs determine whether your design works: the average illuminance across your target surface, the minimum value in the darkest zone, and the uniformity ratio between them. If your workshop simulation shows an average of 85 foot-candles with a minimum of 52 and a ratio of 0.61, you hit IES targets and maintain acceptable uniformity. But if that minimum drops to 35 foot-candles in a corner, your workers experience eye strain in that zone regardless of the average.
The software’s pseudo-color plot and isolines visualize exactly where problem areas occur. You adjust fixture spacing or add a single supplemental fixture rather than over-specifying the entire space. Outdoor projects demand the same rigor: a parking lot simulation might show 3.5 foot-candles average with acceptable spillover at property lines, but if one corner drops to 0.8 foot-candles due to pole spacing, you create a dark zone that triggers safety complaints and liability exposure. The calculation grid prevents these surprises by showing zone-by-zone distribution before installation.
Read the pseudo-color plots and isolines correctly
Pseudo-color plots use warm colors (red, orange) to show bright zones and cool colors (blue, green) to show dim areas. Isolines connect points of equal illuminance, revealing gradients across your space. A well-designed layout shows relatively uniform color distribution with no sharp transitions between warm and cool zones. Sharp color boundaries indicate uniformity problems that require fixture adjustment. Look for dark blue pockets near walls or corners-these spots consistently cause complaints and safety issues in real installations.
Compare the visual representation against your target foot-candle levels. If your target is 50 foot-candles and the plot shows blue (typically 20–30 foot-candles) in a work zone, you need to adjust. The isolines help you identify exactly where to add fixtures or tighten spacing. This visual check catches problems that raw numbers alone might miss.
Verify the luminaire schedule matches your actual products
Professional photometric reports span 5 to 20 pages and include the calculation grid, luminaire schedule, fixture layout diagram, and performance summary that inspectors and stakeholders expect. Your report must list every fixture type with its catalog number, wattage, lumen output, beam angle, color temperature, voltage, and quantity-the exact data contractors need for procurement and municipal inspectors need for code verification.
Include the average, minimum, and maximum foot-candle values prominently so approvers understand whether the design meets local requirements. For outdoor projects, add a spill and trespass analysis showing light distribution at property boundaries; many cities now require this documentation before permits are issued. Cross-reference the luminaire schedule against your supplier’s current product offerings to confirm availability and lead times. If a fixture has been discontinued or the optic you modeled is no longer standard, catch it now rather than discovering the problem during installation.
Account for real-world variables in your interpretation
Real-world results vary from simulations due to installation differences, surface reflectance, voltage fluctuations, and maintenance. Your report should note this limitation so stakeholders understand it’s a prediction tool, not a guarantee. However, photometric planning consistently reduces energy consumption by 20 to 50 percent in commercial spaces when paired with occupancy sensors and daylight harvesting, according to Illuminating Engineering Society research, because the layout eliminates over-lighting and guides control strategy placement.
Verify that the IES data files match your actual fixture models-a mismatch between the simulation and reality is the fastest way to waste money and credibility. Many software platforms export these reports as printable PDFs with graphs and charts that communicate results clearly to non-technical stakeholders. When you review the report yourself, check whether surface reflectance values in the simulation match your actual space (white ceilings reflect more light than dark ones, for example). Confirm that mounting heights and electrical supply voltages in the model match your installation plan. These details transform your validated design into an installation blueprint that contractors and inspectors can trust.
Final Thoughts
Photometric layout planning transforms lighting from guesswork into precision. You now understand what these simulations do, how to build them correctly, and how to interpret results that stakeholders and inspectors actually trust. The three core practices that separate successful projects from costly failures are straightforward: measure your space accurately, select fixtures matched to your geometry and occupant needs, and validate uniformity and foot-candle levels before installation.
The real payoff emerges over time. Warehouse retrofits deliver 70 percent energy savings, office spaces cut annual lighting energy use by 60 percent, and parking lots eliminate dark zones while reducing spillover-all because a photometric layout guided fixture selection and control strategy. These results aren’t accidents; they’re the direct outcome of matching the right fixtures to your space geometry and validating performance before labor and materials are committed.
Tools like OpenLumen make this process accessible without expensive software or steep learning curves, letting you design, validate, and generate professional reports fast enough to support real project timelines.
Your next project starts with a single measurement and a clear understanding of what occupants actually need. Use this photometric layout guide as your reference, validate your design before ordering, and install with confidence. Whether you’re a contractor, distributor, or facility owner, the ability to simulate and communicate lighting performance before installation builds client confidence and eliminates field surprises.
The information provided is for general educational purposes only and should not be considered professional engineering or lighting design advice. Always verify project requirements, local codes, and specifications with qualified professionals before making final decisions.