Photometric hub metrics tell you exactly how light behaves in real installations. Polar charts and BUG ratings cut through guesswork and let you validate designs fast.
At OpenLumen, we’ve seen how contractors waste weeks second-guessing luminaire performance. These two tools eliminate that waste by giving you concrete data before you order anything.
What Polar Charts and BUG Ratings Actually Tell You
Reading Polar Charts for Real Performance Data
Polar charts show luminous intensity across angles from a fixture’s center point. The chart maps candlepower at every direction, revealing whether light concentrates tightly or spreads broadly. A steep drop on the polar plot indicates narrow distribution; a gentle slope indicates wide coverage. This matters because a fixture with center intensity around 2000 candelas and a 50% threshold at 1000 candelas defines your beam angle right there on the graph. You read real photometric data from the manufacturer’s IES file instead of guessing.
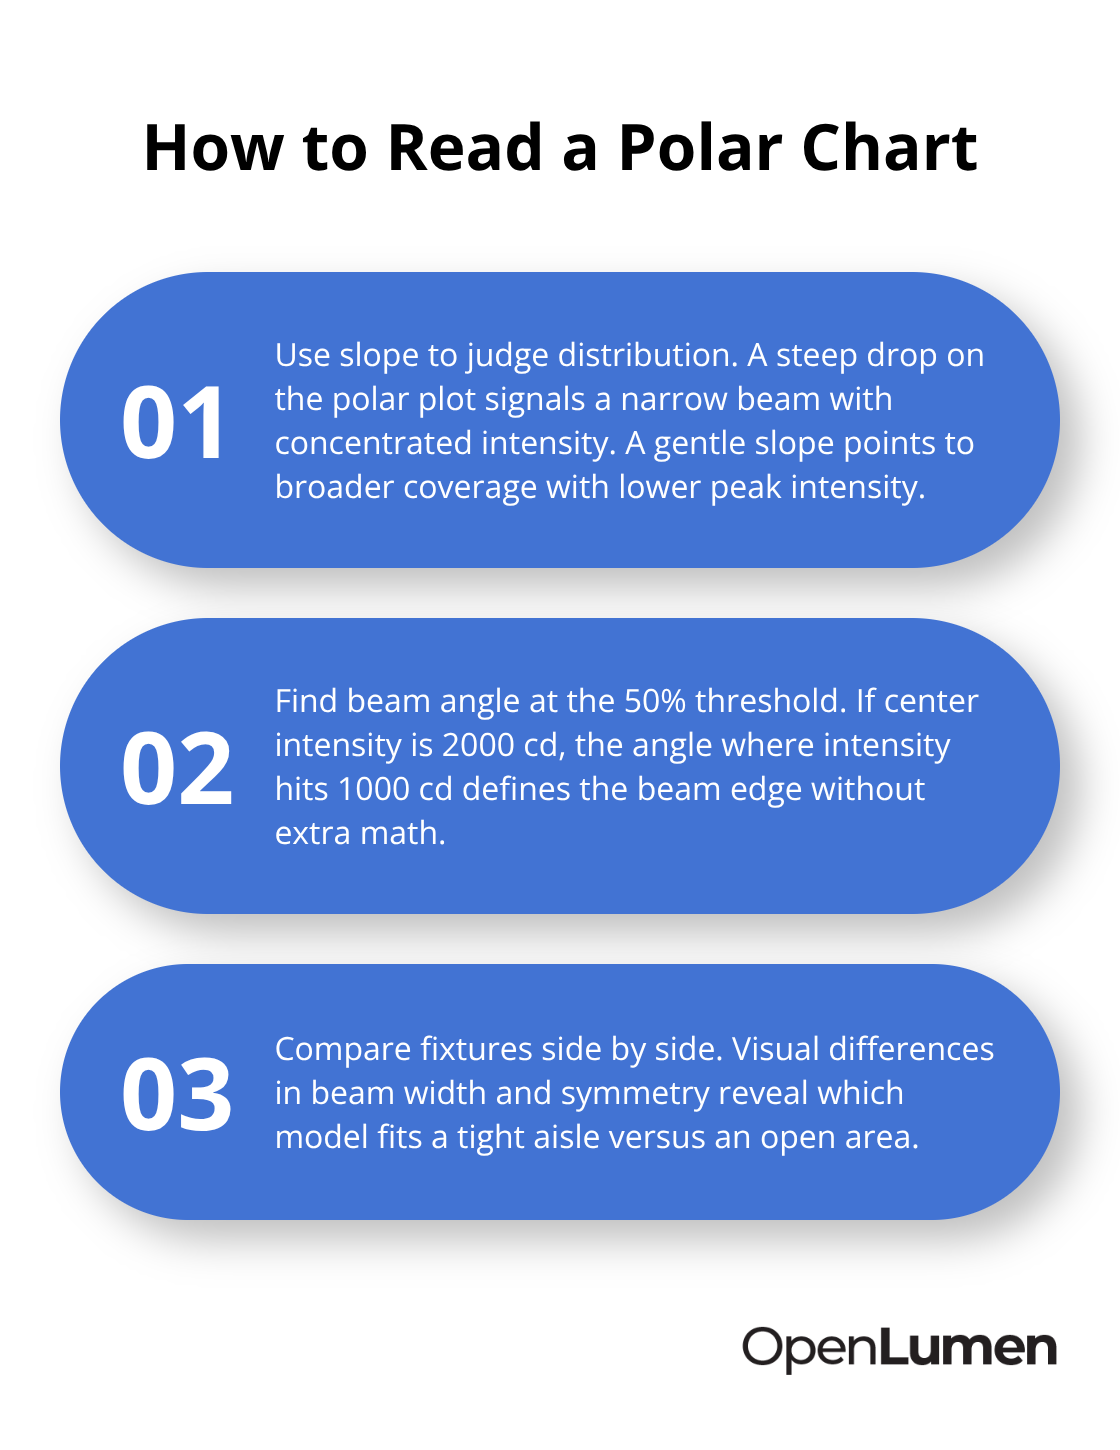
When you compare two fixtures side by side on their polar charts, you immediately see which one suits a narrow aisle versus an open plaza.
Spotting Hotspots and Uneven Light
The symmetry on the polar plot tells you whether the fixture will create hotspots or even illumination. Most contractors skip this step and rely on lumen counts alone, which is why they end up with uneven lighting or dark corners after installation. A symmetric polar chart indicates balanced light distribution across your target area. Asymmetric plots signal potential bright spots that may violate uniformity ratios or create visual discomfort.
Understanding BUG Ratings and Light Pollution Control
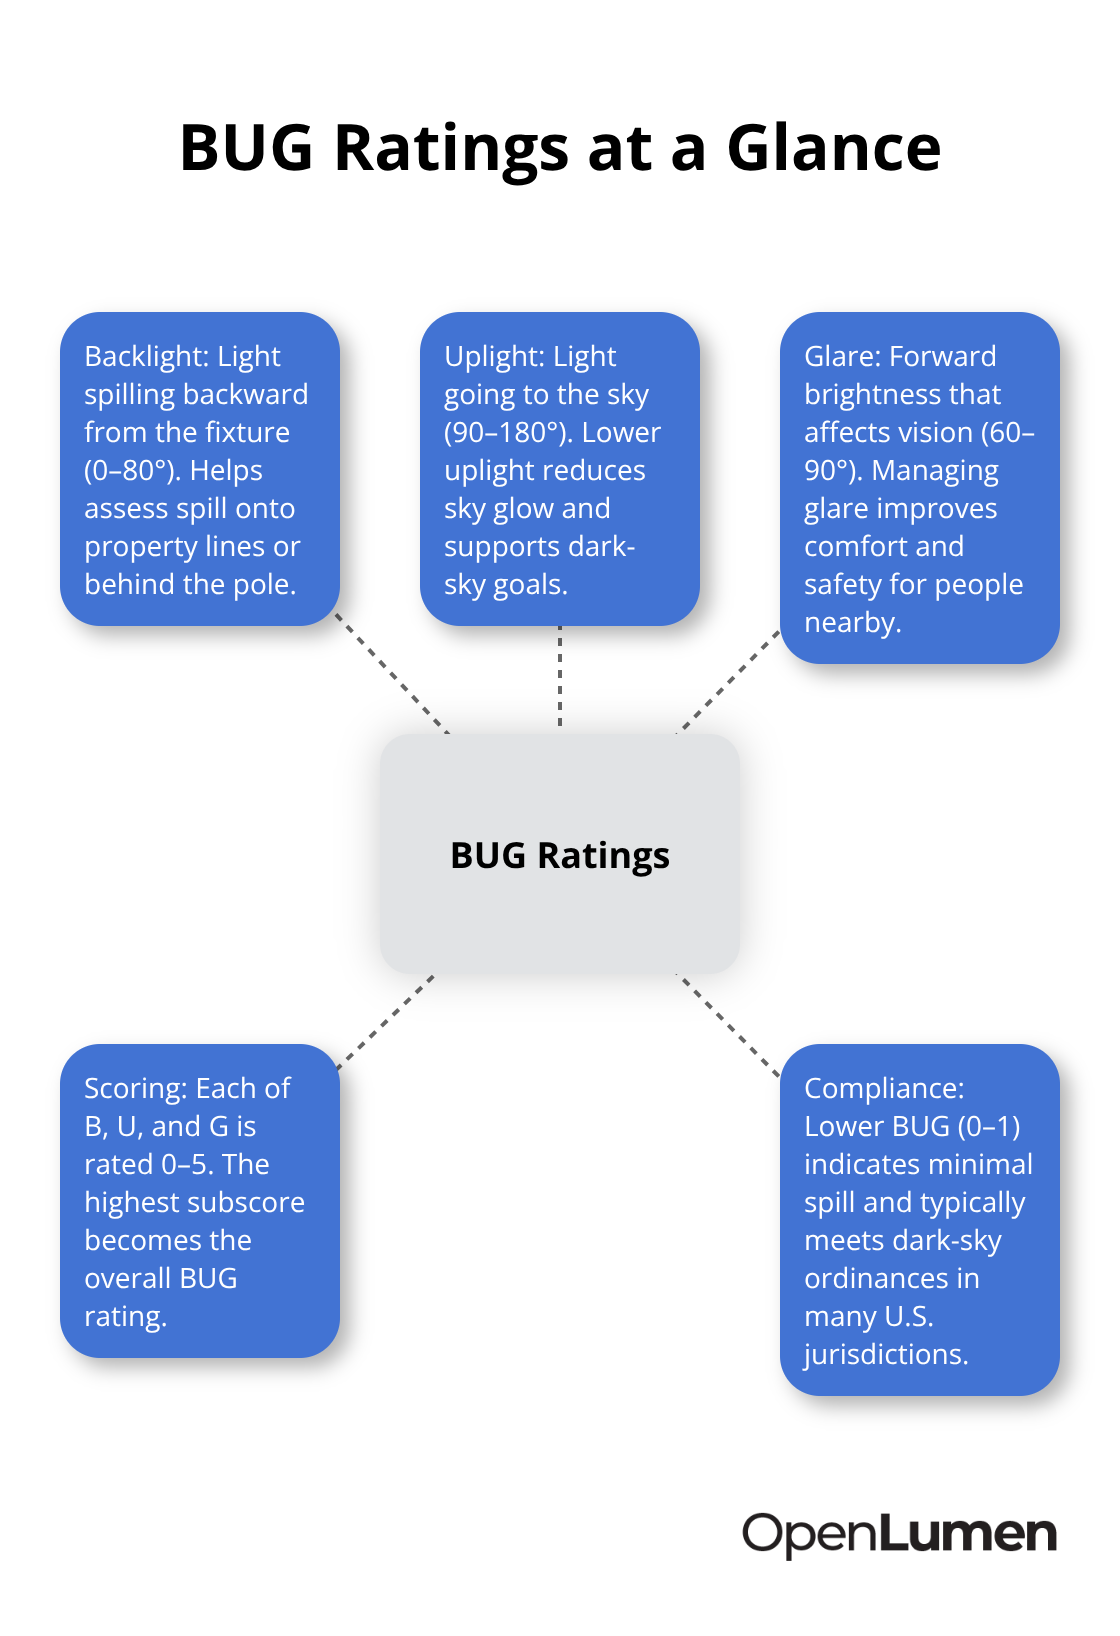
BUG ratings-Backlight, Uplight, and Glare-measure light pollution in three directions. Backlight (0–80°) captures light spilling backward; Uplight (90–180°) measures sky glow; Glare (60–90°) quantifies forward brightness that bothers people. Each component receives a score from 0 to 5, and the highest subrating becomes your fixture’s overall BUG number. A low BUG rating (0 or 1) means minimal spill and complies with dark-sky ordinances in most jurisdictions.
Connecting BUG to Local Codes and Lighting Zones
The Model Lighting Ordinance, developed jointly by the Illuminating Engineering Society and the International Dark Sky Association, uses BUG as the primary regulatory tool. Municipalities increasingly require it for permits. You’ll also see Lighting Zones (LZ-0 through LZ-4) tied to BUG thresholds-LZ-1 covers single-family residential areas and allows higher BUG values than LZ-0 dark preserves. Kelvin temperature limits (often 3000K or below) and footcandle caps (frequently around 5 fc) accompany BUG in most codes.
Validating Your Design in Minutes, Not Weeks
Quick validation means pulling the polar chart and BUG data for your candidate fixtures, then cross-checking against your local Lighting Zone and code limits. This takes 15 minutes instead of weeks of back-and-forth with engineers. You confirm compliance before submitting designs to permitting. With tools that deliver polar charts and BUG ratings instantly, you eliminate delays and move forward with confidence. The next step is learning how to use these metrics in your actual workflow-selecting the right luminaires and accelerating design approval.
How Polar Charts Reveal What Fixtures Actually Do
What Polar Charts Show
Polar charts translate manufacturer data into visual proof of how light behaves at every angle from a fixture. Most contractors never look at them, which is why installations disappoint. The chart plots candlepower (luminous intensity) across angles from the fixture’s optical center, showing whether light concentrates in a tight beam or spreads across a wide area. A center intensity of 2000 candelas with a 50% threshold at 1000 candelas immediately tells you the beam angle without calculation. The steeper the drop on the polar plot, the narrower your usable light cone. A gentle slope indicates broader coverage but lower peak intensity.
Matching Beam Width to Your Application
This distinction matters enormously: a narrow-beam fixture works for accent lighting or long throws, while a broad-beam fixture suits general area illumination. When you overlay two polar charts side by side, you stop guessing which fixture performs better for your specific application. One will clearly concentrate light where you need it; the other will waste output where it serves no purpose. A 10,000-lumen fixture with poor symmetry delivers worse results than an 8,000-lumen fixture with excellent symmetry. Reading the polar chart takes five minutes and prevents costly installation failures.
Spotting Symmetry Problems Before Installation
Symmetry on the polar plot predicts whether your installation will have even illumination or problematic hotspots. Asymmetric polar charts signal uneven light distribution that creates bright zones and dark zones, violating uniformity ratios that municipalities and sports facilities demand. A symmetric plot indicates balanced output across the target area, which means fewer complaints and faster permit approvals. Most contractors rely on lumen counts alone and accept whatever distribution the fixture provides, resulting in 30-40 percent waste and frequent callbacks. The real mistake happens when designers assume a fixture with higher lumens automatically performs better without checking the polar distribution.
Validating Coverage Before You Order
You compare your candidate fixtures’ polar charts against your site’s dimensions and mounting height to confirm adequate footcandle coverage before ordering anything. This validation step compresses weeks of uncertainty into minutes of concrete analysis. Experienced contractors treat polar charts as non-negotiable project documentation rather than optional data. With tools that deliver polar charts instantly alongside other photometric metrics, you eliminate delays and move forward with confidence. The next step is learning how BUG ratings work in practice and how to combine them with polar data for faster design approval.
Using BUG Ratings to Select the Right Fixtures
What BUG Ratings Measure
BUG stands for Backlight, Uplight, and Glare-three measurements that tell you exactly how much light spills where it shouldn’t. Backlight captures light traveling backward from the fixture (0–80°), Uplight measures light going skyward (90–180°), and Glare quantifies forward brightness that affects people’s vision (60–90°). Each component receives a score from 0 to 5, and your fixture’s overall BUG rating is the highest of the three subscores. A fixture rated B2-U1-G3 has a BUG of 3 because Glare is the worst performer.
Matching BUG Ratings to Your Lighting Zone
Municipalities now require specific BUG thresholds based on Lighting Zones. LZ-1 single-family residential areas typically allow BUG ratings up to 3, while LZ-0 dark preserves demand BUG 0 or 1. Before you select a luminaire, check your local code or the Model Lighting Ordinance to find your Lighting Zone, then filter fixtures to only those meeting that threshold. This single step eliminates permit rejections and redesigns. Most contractors skip BUG entirely, submit designs, and face weeks of delays when planners request compliance. You can avoid this entirely by front-loading the BUG check into your fixture selection process.
Combining BUG Data With Polar Charts
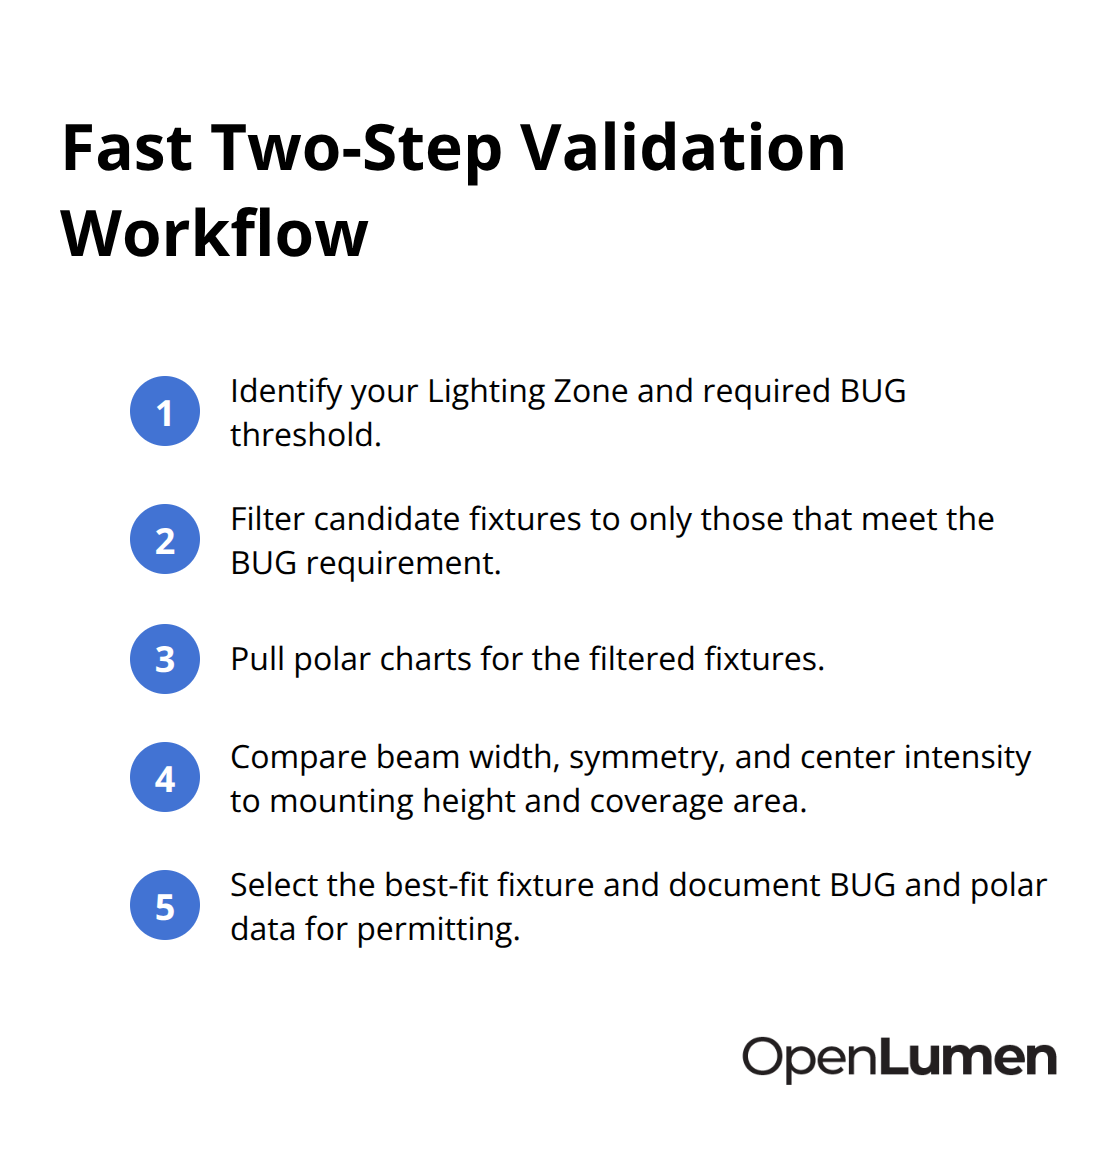
A fixture with excellent BUG compliance but poor beam symmetry still creates hotspots and uniformity problems. Conversely, a symmetric polar chart with poor BUG performance gets rejected at permitting. The fastest path forward involves checking both metrics together before committing to a fixture. Start by identifying your Lighting Zone and required BUG threshold, then filter candidate fixtures to only those that meet it. Next, pull the polar charts for the remaining fixtures and compare beam width, symmetry, and center intensity against your mounting height and coverage area. This two-step process takes 20 minutes and prevents costly backtracking.
Strengthening Your Design Submissions
Document both the BUG rating and the polar chart in your design submission-municipalities increasingly expect this data in permit packages. When you include a professional photometric study showing footcandle grids and compliance with local Kelvin limits (typically 3000K or lower) alongside BUG ratings, approval timelines compress from weeks to days. Contractors who treat BUG and polar data as mandatory project documentation close jobs faster and face fewer callbacks. The real competitive advantage goes to teams that validate designs using these metrics before presenting to clients or submitting permits.
Final Thoughts
Polar charts and BUG ratings transform lighting design from guesswork into measurable validation. You now have two concrete tools that eliminate weeks of uncertainty and prevent costly installation failures. Polar charts show exactly how light distributes from your fixture across every angle, revealing beam width, symmetry, and whether you’ll face hotspots or even illumination. BUG ratings tell you whether your selection complies with local dark-sky ordinances and Lighting Zone requirements before you submit for permits.
The real advantage comes from validating both metrics before you order anything. Start by identifying your Lighting Zone and required BUG threshold, then filter fixtures to only those that meet it. Next, compare polar charts for beam symmetry and coverage against your mounting height and site dimensions. This two-step process takes 20 minutes and prevents redesigns, permit rejections, and callbacks.
Treat photometric hub metrics as mandatory project documentation rather than optional data. Include polar charts and BUG ratings in every design submission, and pair them with professional photometric studies showing footcandle grids and local code compliance. Visit OpenLumen to start validating designs with polar charts and BUG ratings today.
The information provided is for general educational purposes only and should not be considered professional engineering or lighting design advice. Always verify project requirements, local codes, and specifications with qualified professionals before making final decisions.