Most lighting projects fail because designers guess at light distribution instead of measuring it. Uneven illumination wastes energy, creates safety hazards, and leaves spaces looking poorly lit.
At OpenLumen, we’ve seen how proper lumen distribution analysis transforms projects. This guide shows you the tools, methods, and common pitfalls to avoid when mapping light where it actually matters.
Why Poor Light Distribution Costs You Money and Creates Safety Problems
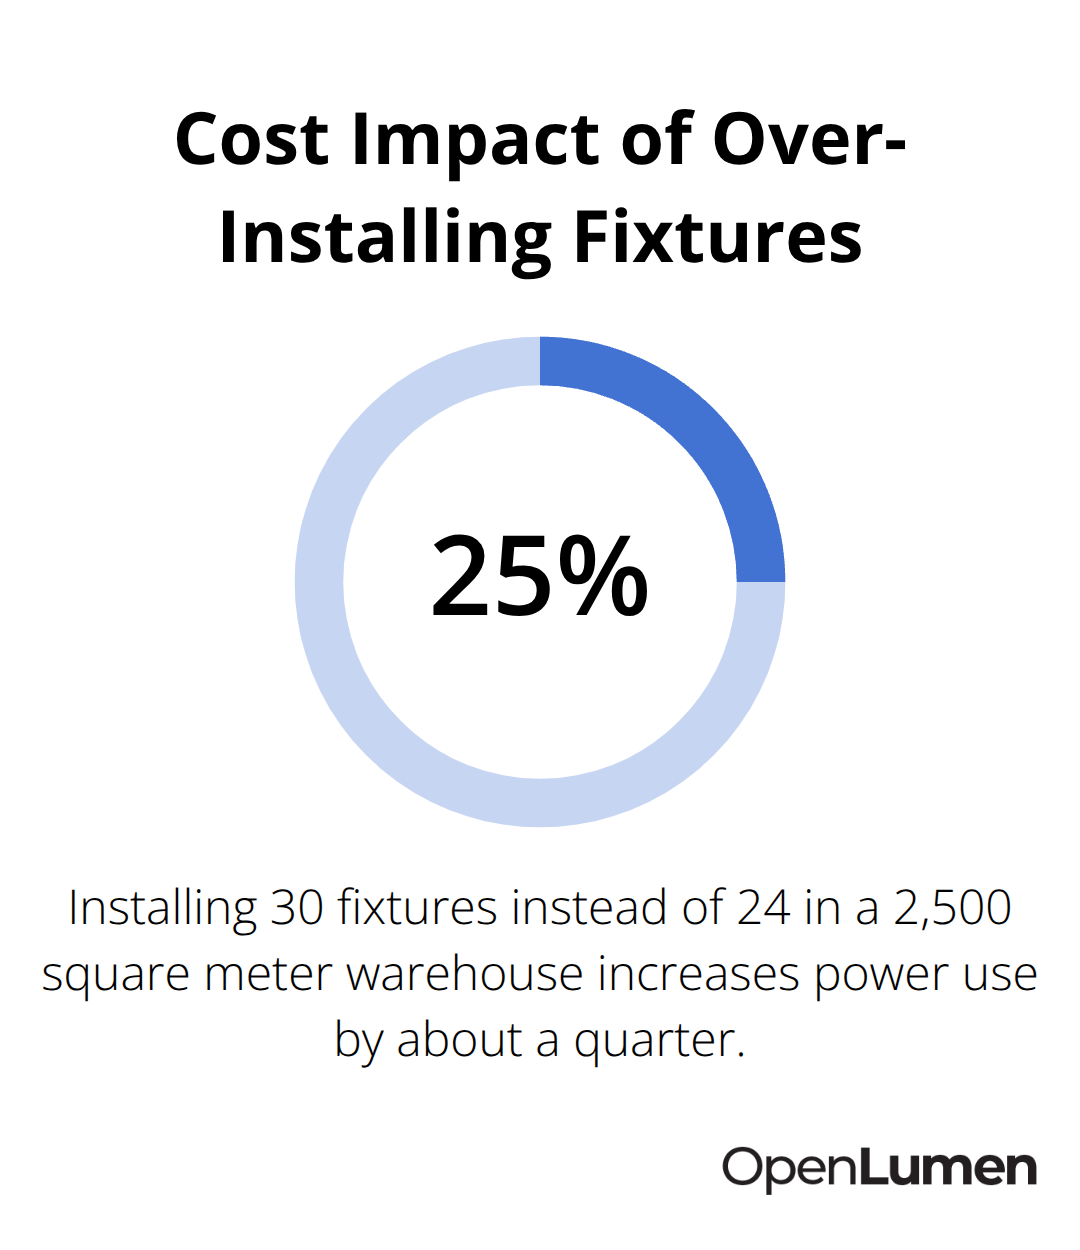
Uneven light distribution drains budgets and creates hazards. When illumination varies across a space, you either install too many fixtures to compensate for dark zones, or you accept inadequate lighting in critical areas. EN12464-1 specifies exact illuminance levels for different tasks-welding requires around 200 lux, grinding around 300 lux, and inspection tasks up to 750 lux depending on detail. Install fixtures without mapping distribution, and you’ll either overshoot the requirement and waste energy, or undershoot and face safety complaints. A warehouse that installs 30 fixtures when 24 would suffice across a 2,500 square meter space consumes roughly 25% more power annually. Over five years, that’s thousands in unnecessary electricity costs. The opposite problem is worse: under-lit assembly areas cause errors, worker fatigue, and liability exposure.
Poor distribution also creates glare hotspots where light concentrates unevenly, reducing visibility exactly where workers need it most.
Surface Reflectance Changes Everything
Surface reflectance directly affects how much light actually reaches your work plane. If you ignore that your ceiling reflects 70% of light but your walls only reflect 50%, your calculations will be wrong. The Utilization Factor changes with room geometry and reflectance. Without accounting for this, you might achieve 321 lux in your lumen method estimate but only 196 lux when you actually install fixtures, as simulation software like Dialux reveals. That gap means redesign costs, delayed projects, and frustrated clients.
Fixture Spacing and Height Determine Success
Spacing and mounting height determine whether light reaches the work plane or gets wasted. If fixtures are too high or spaced too far apart, light scatters before reaching surfaces. If they’re too close together, you overspend on hardware and installation labor. The lumen method formula-E = F × n × N × UF × MF / A-protects you against these mistakes. It calculates how many luminaires you actually need based on target illuminance, space size, and reflectance. Contractors who skip this step often install based on habit or rough estimates, leading to callback work and budget overruns. Safety compliance is non-negotiable. Inadequate lighting in manufacturing increases accident rates, creates liability exposure, and violates workplace standards. Proper distribution analysis ensures task-specific requirements are met consistently across the entire space.
Photometric Data Reveals Light Behavior
Every luminaire has a polar distribution curve showing how light spreads in two principal planes: C90-C270 (vertical) and C0-C180 (horizontal). This curve tells you whether the fixture produces concentrated, asymmetrical, or diffuse light. Street lighting needs asymmetrical distribution to direct light onto roads while minimizing facade illumination and skyglow. Warehouse aisles benefit from targeted asymmetry that improves visibility where needed while reducing wasted spill. General office spaces typically use more symmetrical distributions for even coverage. Without this data, you design blind. The photometric curve lives in the luminaire’s datasheet-extract it before specifying anything. Browser-based platforms now let you upload photometric files, run illuminance analysis in real time, and see exactly where light lands on your floor plan. This removes the guesswork and shows dark zones before installation begins.
How to Analyze Lumen Distribution Without Guessing
Extract Photometric Data Before You Specify Anything
Photometric data reveals light behavior. Every luminaire manufacturer publishes a polar distribution curve that shows exactly how light spreads in space, and you need this data before you specify a single fixture. The curve displays intensity in two principal planes: C90-C270 (the vertical plane through the luminaire) and C0-C180 (the horizontal plane perpendicular to the luminaire’s axis). Steep peaks in these curves indicate concentrated, narrow beams. Flat curves indicate diffuse, spread-out light. A street lighting fixture shows a sharp asymmetrical peak directed downward and forward to illuminate pavement while blocking light from hitting building facades. A warehouse general lighting fixture shows a broader, more symmetrical distribution. The polar chart lives in the luminaire’s datasheet-extract it before designing anything. Without it, you choose fixtures based on wattage and price alone, which guarantees uneven illumination.
Run Illuminance Analysis on Your Actual Floor Plan
Illuminance analysis translates photometric data into real-world results on your actual floor plan. You upload your space dimensions, mounting heights, fixture positions, and the luminaire’s photometric file into analysis software, and the system calculates illuminance at every point on your work plane. EN12464-1 specifies 200 lux for welding tasks, 300 lux for grinding, and up to 750 lux for detailed inspection work. When you run illuminance analysis on a proposed layout, you immediately see whether you meet these requirements uniformly across the space or whether dark zones exist. A warehouse layout might show 321 lux in your lumen method calculation but only 196 lux in detailed simulation software like Dialux, revealing a critical gap before installation.
Use Browser-Based Platforms to Speed Up Design Decisions
Browser-based platforms eliminate the need for expensive desktop software and steep learning curves. You upload photometric data, define your space, position fixtures, and see illuminance results instantly without installation delays or callback work. These platforms generate professional reports showing polar charts, BUG ratings (Backlight, Uplight, Glare), zonal lumens, and illuminance maps that you present to clients or use for compliance verification. The real advantage is speed: a contractor tests five different fixture layouts in an afternoon instead of waiting days for simulation results or discovering problems on-site.
Account for Surface Reflectance to Match Real Conditions
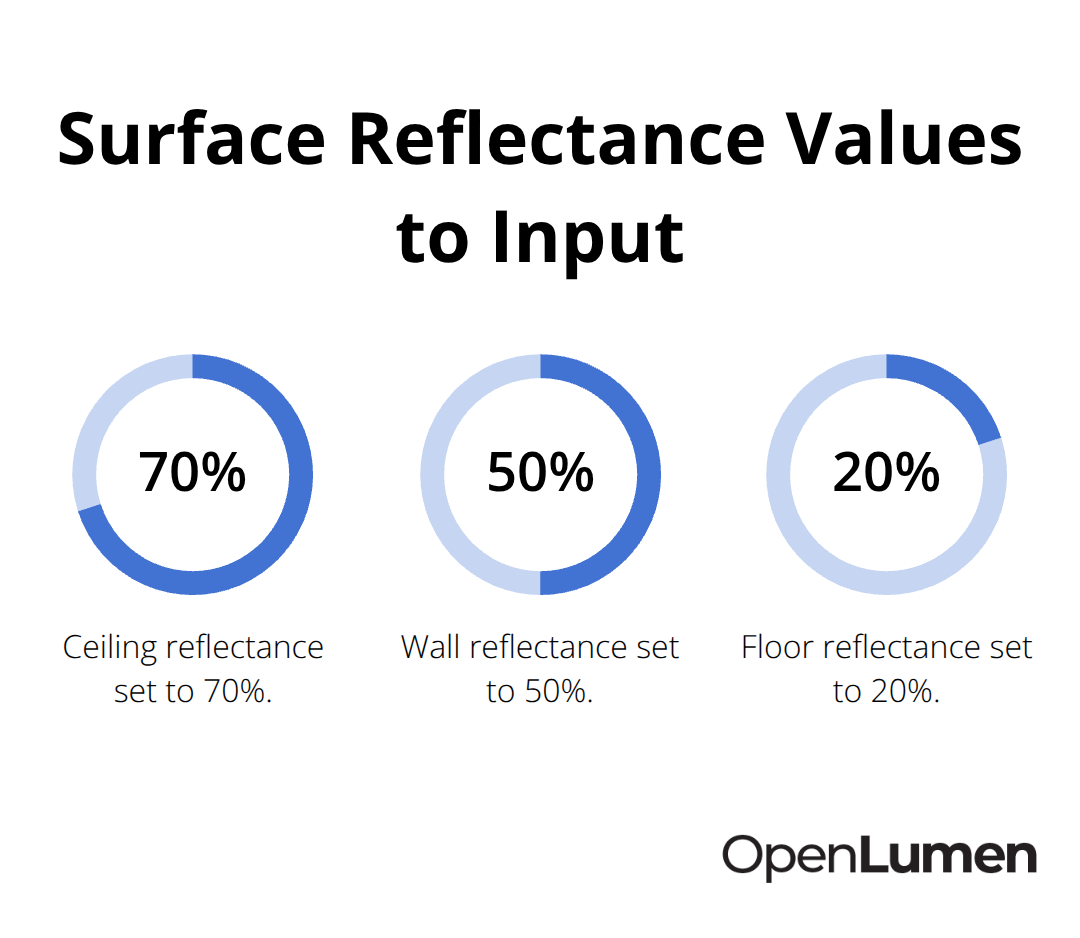
Surface reflectance values directly impact accuracy. Input ceiling reflectance at 70%, walls at 50%, and floor at 20% into your analysis, matching your actual space conditions. If you guess at reflectance or ignore it entirely, your calculated illuminance diverges sharply from what you actually achieve.
Measure reflectance with a reflectometer if possible, especially for dark or unusual surfaces. The Utilization Factor (UF) depends entirely on these reflectance values and room geometry, so accuracy here prevents costly redesigns. Once you validate your layout against real-world conditions, you move from estimation to confidence-and that confidence determines whether your next step is specification or redesign.
Where Designers Go Wrong with Light Distribution
Task-Specific Requirements Demand Precision, Not Guesswork
Most lighting projects fail at the specification stage because designers skip analysis and rely on rules of thumb instead. EN12464-1 sets exact illuminance levels for different work: welding at 200 lux, grinding at 300 lux, detailed inspection up to 750 lux. A designer who ignores these standards and installs based on general office defaults will undershoot manufacturing areas and waste energy on spaces that need less light.
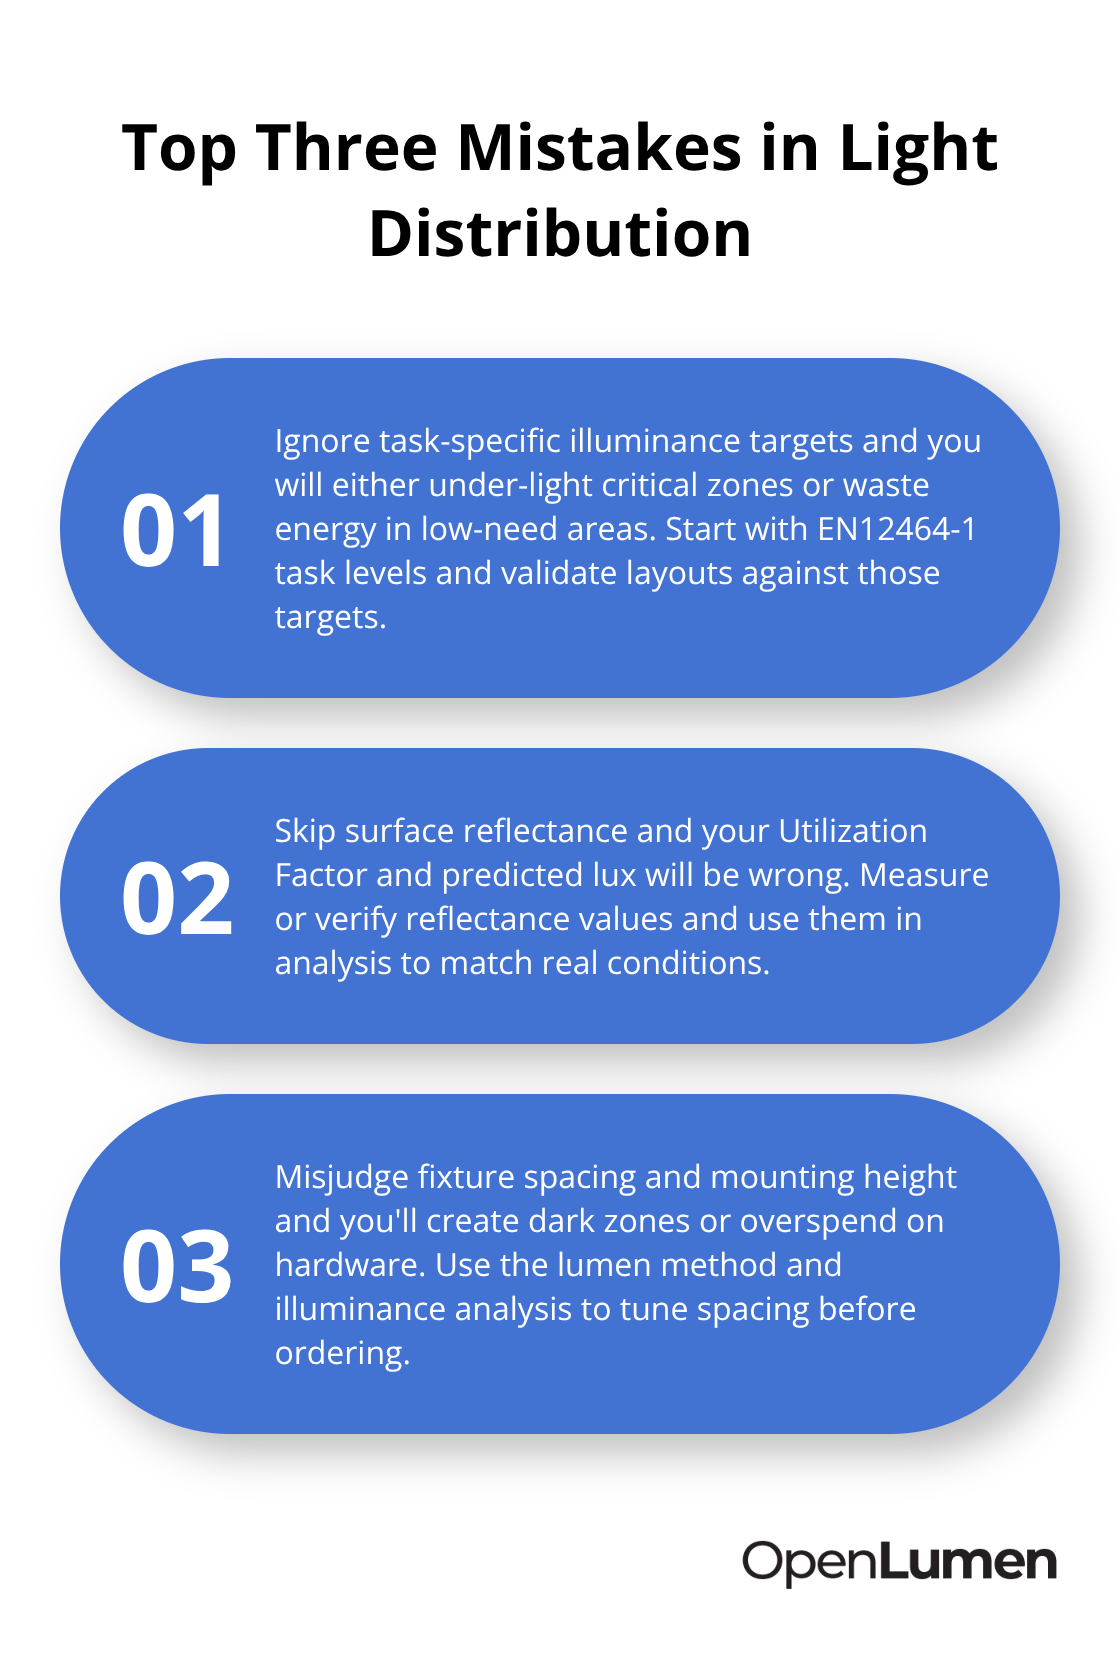
Workers in under-lit zones make errors, file safety complaints, and create liability exposure. Over-lit areas consume excess electricity. Neither outcome serves the project. The fix requires reading task requirements before selecting fixtures, then validating your layout against those specific targets using illuminance analysis. A warehouse assembly area and a warehouse storage aisle have completely different lighting needs, yet contractors frequently treat them identically.
Surface Reflectance Determines Real-World Performance
Surface reflectance determines whether your design works in reality or fails on installation day. Most designers either ignore reflectance entirely or input generic assumptions like 70% ceiling, 50% walls, 20% floor without checking actual conditions. A warehouse with aged concrete walls might reflect only 30% instead of 50%, which shrinks your Utilization Factor and reduces work-plane illuminance by 15 to 20 percent. When detailed simulation software like Dialux runs after installation, you discover you’re 100 lux short of target. The redesign costs money and delays the project. Measure reflectance with a reflectometer before analysis starts, especially for dark or unusual surfaces. Input those real values into your browser-based platform and validate that your proposed layout actually meets requirements under actual site conditions.
Fixture Spacing and Mounting Height Errors Compound Problems
Fixture spacing and mounting height errors compound these problems. A designer who places fixtures too high or spaces them too far apart creates dark zones between fixtures while wasting light that never reaches the work plane. The lumen method formula protects against this: calculating required fixture count based on target illuminance, space dimensions, reflectance, and maintenance factors reveals the minimum hardware needed to meet standards uniformly. Contractors who skip this calculation and install based on habit or supplier recommendations almost always get it wrong. Test your spacing and height assumptions using illuminance analysis before ordering fixtures. A 50 meter by 50 meter warehouse at 6 meters mounting height requires different spacing than the same space at 4 meters. Browser-based platforms show you exactly where illuminance falls short so you adjust layout before installation begins, not after callbacks start arriving.
Final Thoughts
Proper lumen distribution analysis stops guessing and starts measuring. The three mistakes covered in this guide-ignoring task-specific requirements, skipping surface reflectance, and miscalculating fixture spacing-account for most lighting failures. Avoid them by extracting photometric data before you specify anything, running illuminance analysis on your actual floor plan, and validating your layout against real surface conditions.
Start with your space dimensions, mounting height, and task requirements, then extract the luminaire’s polar distribution curve from the manufacturer’s datasheet. Input your actual surface reflectances (measure them if possible) into your analysis platform, run illuminance calculations, and identify dark zones before installation begins. This workflow takes hours instead of days and prevents costly redesigns after fixtures are mounted.
OpenLumen removes the software barrier that stops many contractors and designers from running proper lumen distribution analysis. The platform lets you upload photometric files, position fixtures on your floor plan, and see illuminance results instantly without expensive desktop software or steep learning curves, then generate professional reports showing polar charts, BUG ratings, and illuminance maps that validate your design against standards before you order a single fixture.
The information provided is for general educational purposes only and should not be considered professional engineering or lighting design advice. Always verify project requirements, local codes, and specifications with qualified professionals before making final decisions.