Lighting layout analysis often becomes the bottleneck in project schedules. Teams waste hours on manual calculations, miscommunications, and design revisions that could have been caught earlier.
At OpenLumen, we’ve seen firsthand how the right approach transforms timelines. This guide shows you the metrics that matter, the workflows that work, and the mistakes that cost you days.
Key Metrics That Matter in Lighting Design
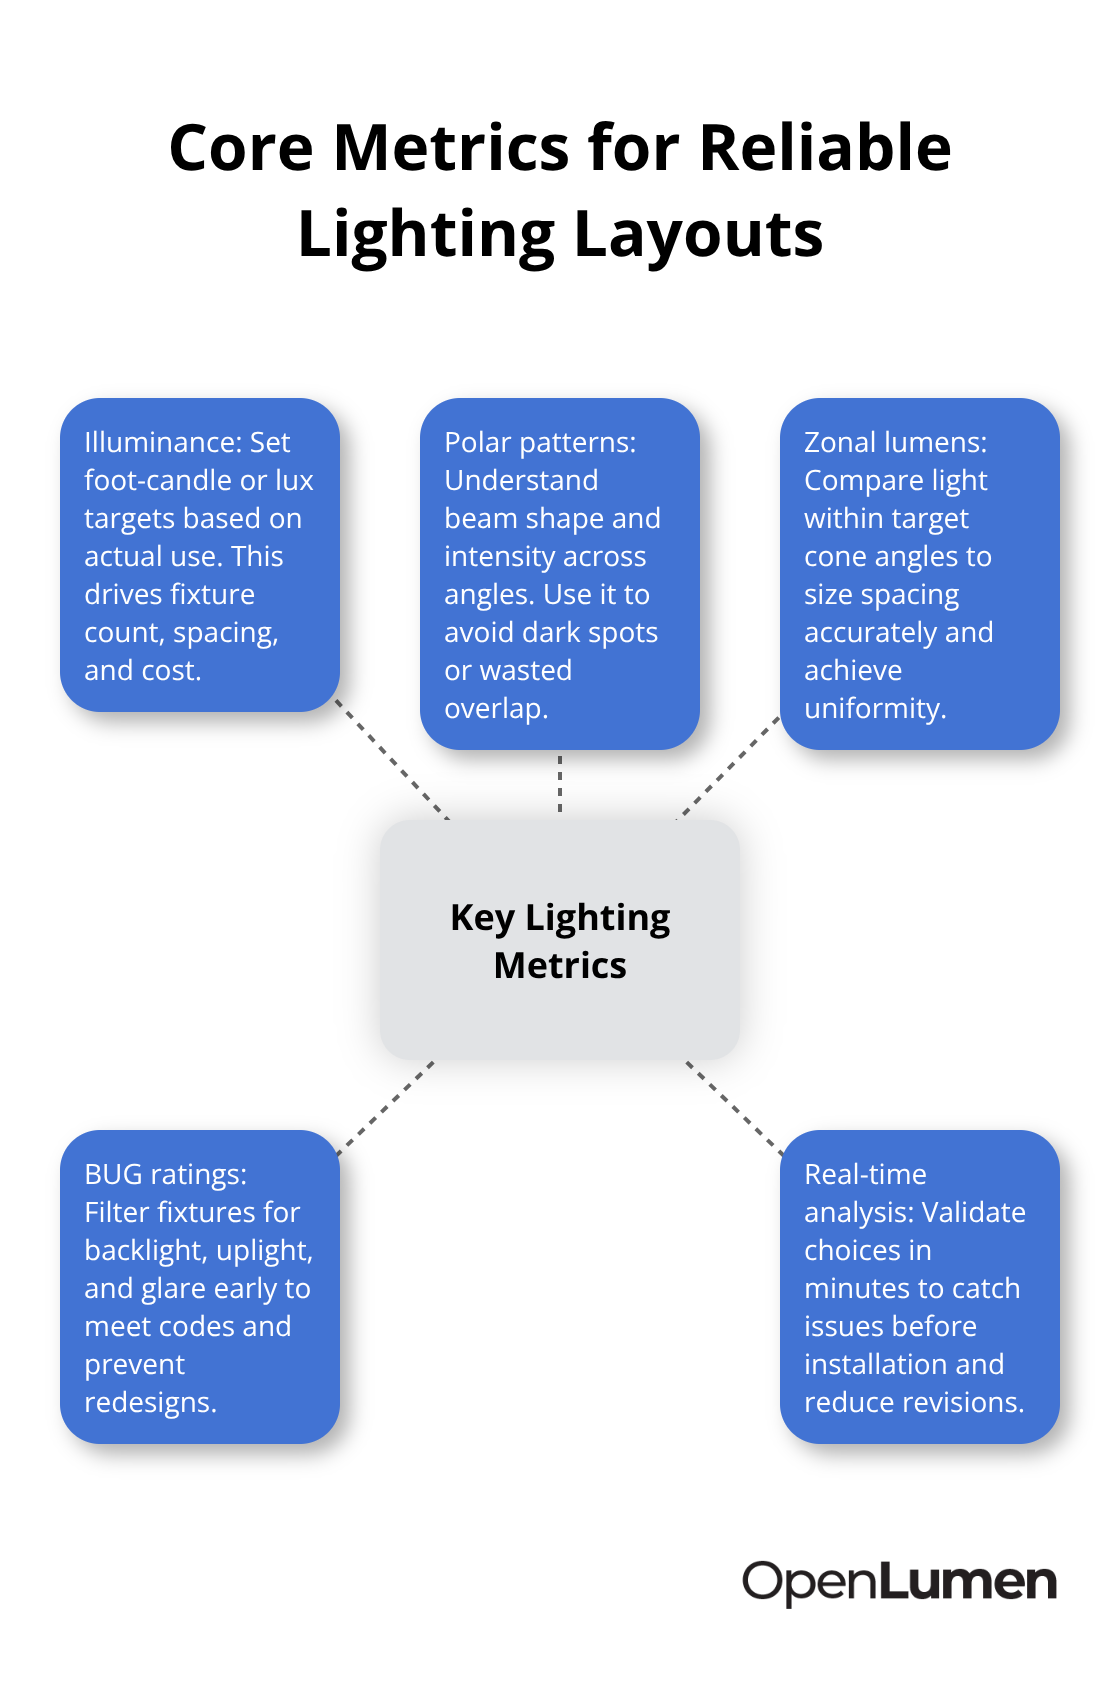
Illuminance forms the foundation of every lighting layout, and it’s the number you must nail before anything else matters. Measured in foot-candles (fc) or lux (lx), illuminance tells you how much light actually lands on a surface-not how bright a fixture is, but what the space receives. A warehouse needing 30–50 fc for general tasks requires a completely different fixture strategy than one needing 100–200 fc for detailed inspection areas. This difference drives your fixture count, spacing, and total project cost. Too many teams skip this step and rely on guesswork, then face costly revisions when the client sees the installed result. Start every project by defining your illuminance target based on the space’s actual use. This single decision cascades into everything that follows.
Polar Patterns Reveal How Light Actually Distributes
Once you know your illuminance target, polar patterns show you how each fixture distributes light in three dimensions. A polar chart maps lumens across angles, showing whether a fixture throws light in a narrow beam or spreads it wide. A 40-degree beam angle covers less area but concentrates intensity; a 120-degree beam spreads light broadly but with lower intensity at distance. This matters enormously for spacing decisions. If you place wide-beam fixtures too far apart, you create dark spots. If you crowd narrow-beam fixtures, you waste energy and overheat zones. Photometric data gives you the exact polar pattern for each luminaire, eliminating guesswork. Without it, you’re essentially designing blind.
Zonal Lumens Let You Calculate Fixture Counts Accurately
Zonal lumens-the light output within specific cone angles-let you calculate how many fixtures you actually need for your illuminance target and ceiling height. A high-bay fixture delivering 27,000 lumens in a 40-degree cone performs very differently than one delivering the same total lumens in a 120-degree cone. This distinction determines whether your layout achieves uniform illumination or creates hot spots and shadows. When you know the zonal lumens for your selected fixture, you can run precise spacing calculations instead of relying on rules of thumb that often miss the mark.
BUG Ratings Protect Your Design from Code and Performance Issues
BUG ratings measure Backlight, Uplight, and Glare in specific zones around a fixture, expressed in percentages. Backlight (light going behind the fixture) matters in retail and commercial spaces where it creates unwanted glow. Uplight (light going toward the ceiling) wastes energy and creates sky glow in outdoor applications. Glare (light in the 55–90 degree zone from nadir) causes eye discomfort and reduces visibility. A fixture with a BUG rating of B2-U1-G1 is drastically different from one rated B4-U3-G3, and that difference affects whether your design passes energy codes and client expectations. Many contractors overlook BUG until late in the process, forcing redesigns. Check BUG early-it’s a non-negotiable filter for your fixture selection.
Real-Time Analysis Catches Problems Before Installation
When you run real-time illuminance analysis with accurate photometric data, you catch spacing problems, beam-angle mismatches, and efficiency issues before installation begins, not after. This is where projects accelerate. Teams that verify photometric performance upfront reduce revisions by eliminating the back-and-forth that kills schedules. The next section shows you how to build workflows that make this verification fast and automatic, turning analysis from a time sink into a competitive advantage.
How to Make Design Validation Fast and Automatic
Real-Time Analysis Stops Problems Before Installation
Real-time illuminance analysis eliminates the guesswork that kills project schedules. Load accurate photometric data into a layout tool and run instant analysis to see exactly where light lands, whether spacing works, and if your fixture selection meets the illuminance target-all before you send a quote to the client. Teams that skip this step pay for it later: a contractor discovers mid-installation that fixture spacing creates dark zones, or a designer realizes the chosen beam angle doesn’t match the ceiling height. These discoveries trigger revisions, client calls, and delays. Running analysis upfront costs minutes; fixing problems after installation costs days.
The data backs this up: contractors using layout software with real-time analysis save 2+ hours on Christmas lighting estimates, 4 hours on landscape lighting, and up to 6 hours on complex commercial projects. That’s not just time savings-it’s the difference between closing one job per week and closing three.
Select Fixtures with Complete Photometric Data
Start with fixtures that include complete photometric data: polar patterns, zonal lumens in your target cone angles, and BUG ratings. Plug those fixtures into your layout with accurate room dimensions and ceiling height. Run the illuminance analysis immediately. If spacing shows hot spots or dark zones, adjust fixture placement or swap to a different beam angle right then. This iterative validation takes 15–20 minutes for most projects and catches 90% of problems before they reach the client. The result is a design you can stand behind and a timeline that doesn’t slip.

Automated Reports Transform Hours Into Minutes
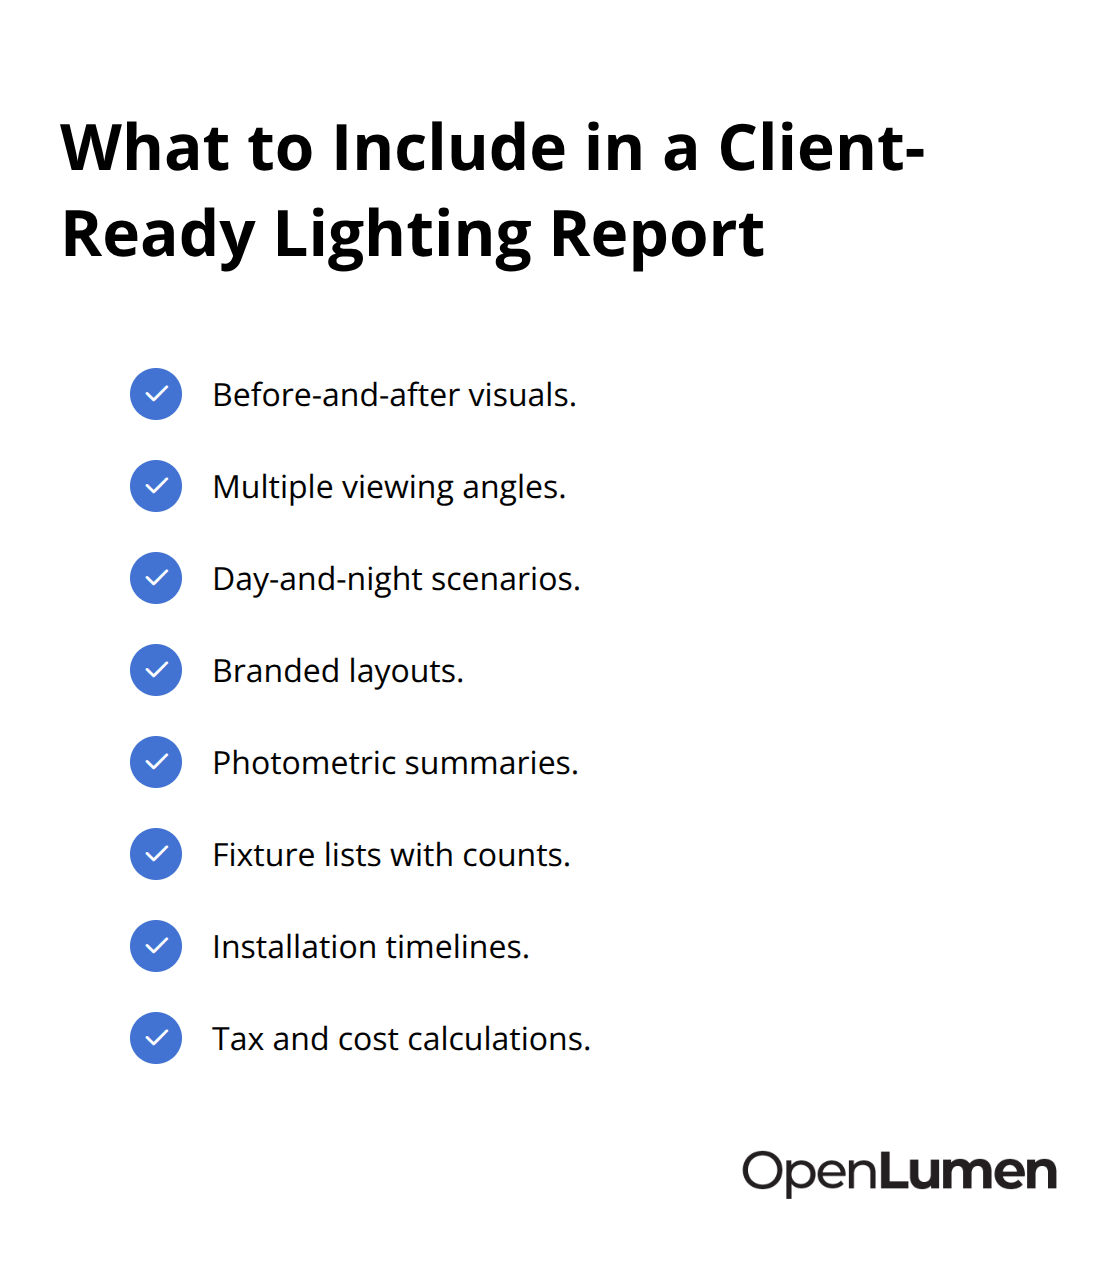
Automated report generation transforms hours of manual work into a few clicks. Instead of building spreadsheets with fixture counts, lumen totals, and wiring calculations-tasks prone to arithmetic errors and inconsistency-modern tools calculate everything in real time and format it into a client-ready document. A detailed proposal that once took 45–60 minutes to assemble now generates in under 5 minutes, complete with photometric data, fixture lists, installation timelines, and even tax calculations.
This speed directly impacts your close rate: research shows that 68% of customers hire the first contractor who provides a detailed quote. Being first matters enormously, and automation lets you respond within hours instead of days. Reports should include before-and-after visuals, multiple viewing angles, day-and-night scenarios, and branded layouts so clients see exactly what they’re paying for. Professional presentations enable a 15% price uplift because clients perceive higher value when they see realistic renderings instead of sketches.
Shared Files Align Designers, Contractors, and Distributors
Coordination between designers, contractors, and distributors moves faster when everyone accesses the same live design file instead of emailing outdated versions back and forth. A designer updates fixture placement, and the contractor instantly sees the new spacing and electrical load calculations. A distributor checks inventory availability and flags long-lead items before the order is placed.
This shared-file workflow eliminates the email chains and version confusion that derail timelines. Establish a single source of truth-one shared design file-and assign clear roles: who approves changes, who owns the final design, and who handles revisions. When a client requests a modification, you update the shared layout once, and the updated illuminance analysis, fixture list, and electrical calculations propagate automatically to everyone. This prevents the scenario where the designer approves one version, the contractor quotes another, and the distributor orders a third. Alignment on one design cuts approval cycles from days to hours.
Move From Validation to Specification
Once your design passes real-time analysis and your team aligns on the shared file, you move into specification-the phase where you lock down exact fixture models, electrical requirements, and installation details. This transition separates teams that ship projects on time from those that face last-minute surprises.
Where Projects Actually Lose Time
Spreadsheets Create Version Chaos and Hidden Errors
Spreadsheet workflows destroy project timelines because they force you to re-enter data at every stage. A designer calculates fixture counts in one spreadsheet, the contractor builds a cost estimate in another, and the distributor maintains a third inventory file. When the client requests a spacing change, you update the designer’s sheet, but the contractor’s estimate and the distributor’s lead-time calculations stay outdated. This version mismatch creates confusion: the team quotes one fixture layout while ordering another.
Revisions multiply because no single source of truth exists. Spreadsheets also hide errors until late in the process. A misplaced decimal in a lumen calculation or a typo in a fixture model number goes unnoticed until installation, when the wrong fixtures arrive or spacing creates dark zones. These mistakes cost days of rework and damage client relationships.
Teams that rely on spreadsheets typically spend 45–60 minutes assembling a single proposal because every number requires manual entry and verification. That’s time spent fighting the tool instead of selling the project.
Photometric Verification Gaps Expose Problems During Installation
Skipping photometric verification early is the silent killer of project schedules. Many teams select fixtures based on lumen ratings alone, assuming that 27,000 lumens in one fixture equals 27,000 lumens in another. That assumption ignores polar patterns, zonal lumens, and beam angles. A narrow-beam fixture concentrates those lumens in a tight cone; a wide-beam fixture spreads them across a larger area. Only photometric data reveals which fixture actually delivers the illuminance your space needs at your ceiling height.
Teams that skip this verification discover spacing problems during installation, forcing costly adjustments. A contractor realizes mid-project that fixtures placed 30 feet apart create dark zones, or a designer learns that the chosen beam angle doesn’t match the 20-foot ceiling height. Fixing these problems after installation begins means pulling fixtures, rewiring, and rescheduling.
Early photometric analysis prevents this entirely. Running illuminance analysis before you send a quote to the client takes 15–20 minutes and catches 90% of problems upfront.
Disconnected Teams Work From Outdated Information
Poor communication between designers, contractors, and distributors extends timelines because each team works from different versions of the design. A designer sends a layout to the contractor, the contractor modifies spacing without updating the designer, and the distributor orders fixtures based on the original design. When installation begins, the team discovers they ordered the wrong quantities or models.
Email-based workflows amplify this problem because there’s no single file that reflects the current design state. Establishing shared access to a live design file eliminates this friction. When a designer updates fixture placement, the contractor instantly sees the new spacing and electrical load calculations. The distributor checks inventory against the current design, not an outdated attachment. Approval cycles compress from days to hours because everyone accesses the same information simultaneously.
Final Thoughts
The difference between projects that ship on time and those that slip comes down to validation. Modern lighting layout analysis tools eliminate manual work, version confusion, and late-stage surprises that derail schedules. When you run real-time illuminance analysis with accurate photometric data, coordinate through shared files, and generate reports automatically, you compress timelines from weeks to days.
Teams that start with illuminance targets and polar patterns catch spacing problems before installation begins. They verify beam angles against ceiling height, identify BUG rating issues early, and use shared design files so designers, contractors, and distributors work from the same current information instead of outdated email attachments. This alignment prevents the version chaos that forces rework and extends timelines unnecessarily.
The numbers demonstrate the impact: contractors save 2 to 6 hours per project depending on complexity, which compounds into capacity for 30 to 45 additional jobs annually. Close rates jump from 25–35% to 60–80% when clients see professional renderings instead of sketches, and premium pricing becomes feasible because clients perceive higher value in polished presentations. OpenLumen lets you create photometric layouts, run real-time illuminance analysis, and generate professional reports without the complexity of traditional CAD tools, so you can start your next project by defining illuminance targets and running analysis before you quote.
The information provided is for general educational purposes only and should not be considered professional engineering or lighting design advice. Always verify project requirements, local codes, and specifications with qualified professionals before making final decisions.