
Lighting calculation methods determine whether your project succeeds or fails. The difference between manual spreadsheets and modern digital tools isn’t just convenience-it’s accuracy, speed, and confidence in your final design.
At OpenLumen, we’ve seen contractors waste weeks on outdated approaches when faster, more reliable methods exist. This guide walks you through both traditional and modern techniques so you can choose what actually works for your projects.
How the Lumen Method Still Powers Quick Estimates
The Core Formula and When It Works
The lumen method remains the fastest way to size fixtures for indoor spaces when you need a rough answer in minutes. The core formula is straightforward: E = F × n × N × UF × MF / A, where E is your target illuminance in lux, F is the initial lumens per lamp, n is the number of luminaires, N is lamps per luminaire, UF is the utilization factor, MF is the maintenance factor, and A is the area in square meters. For a 50 m × 50 m warehouse needing 200 lux with 19,000 lumen fixtures, this formula tells you roughly 30 luminaires will work.
Understanding the Variables Behind the Numbers
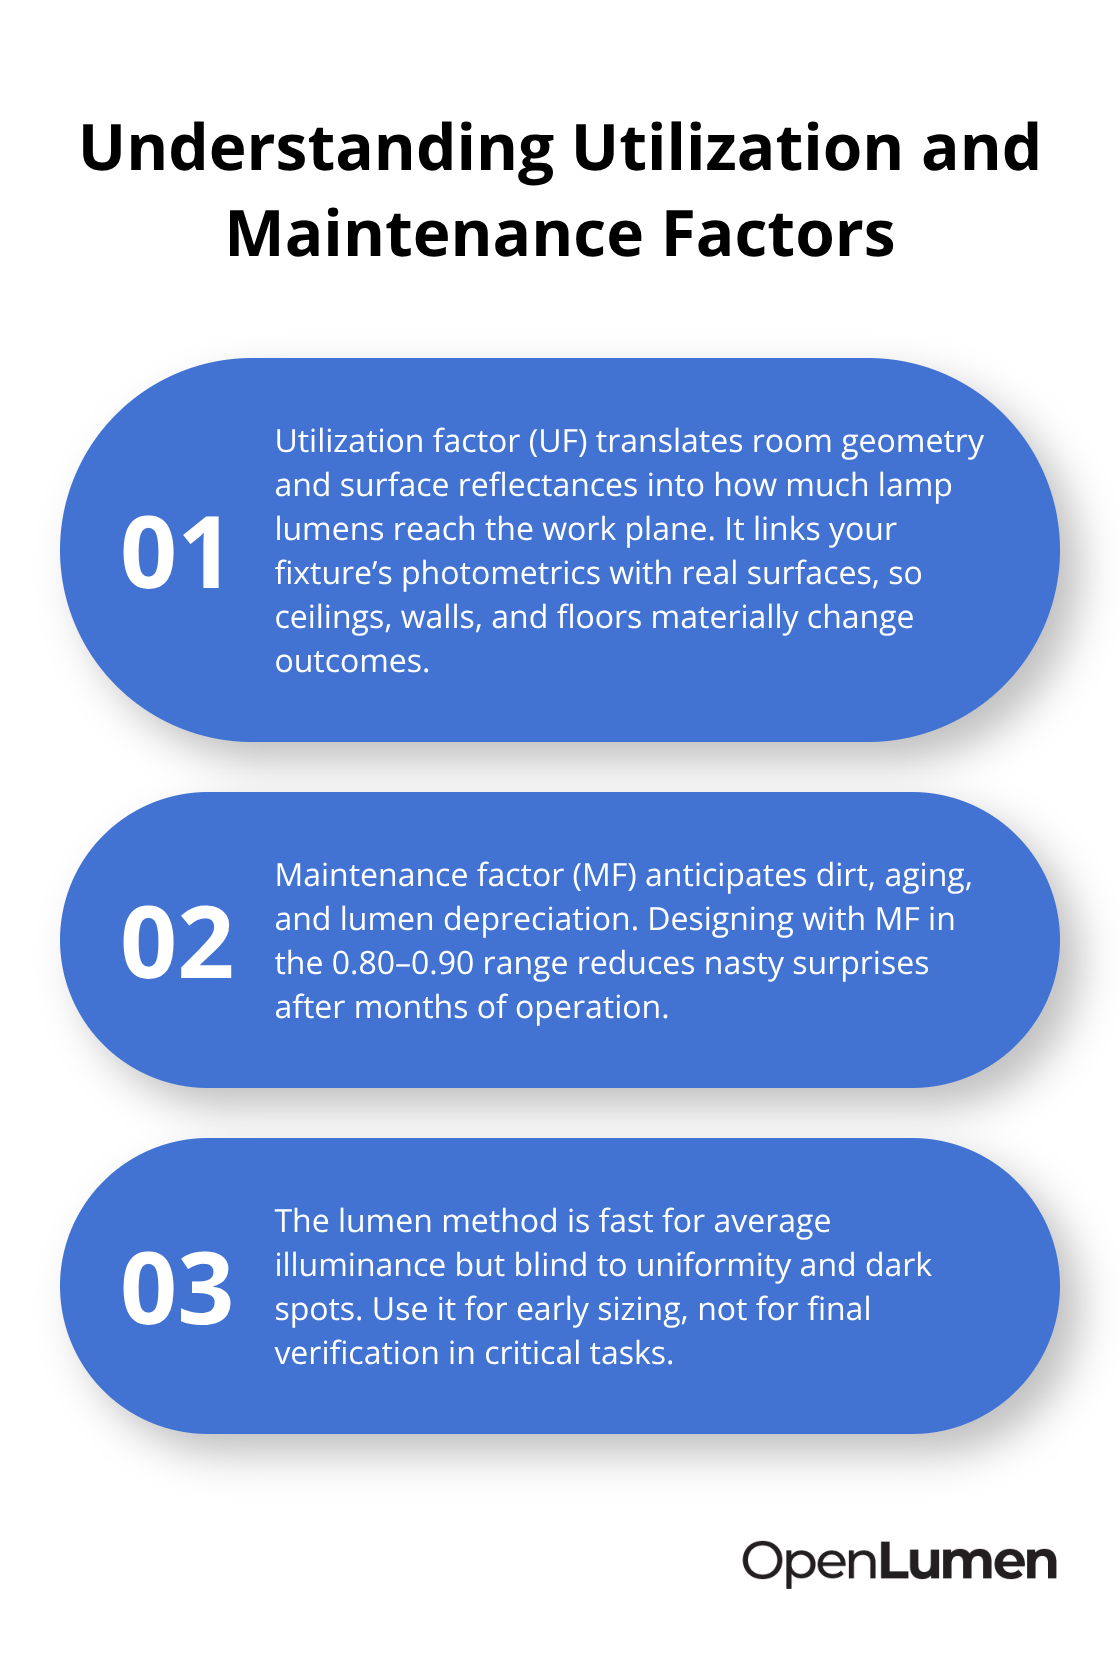
The method works because it accounts for how room geometry and surface reflectances affect light distribution through the utilization factor, which you derive from standard tables based on ceiling reflectance around 70–90 percent, wall reflectance 30–70 percent, and floor reflectance 10–30 percent. Maintenance factor typically sits at 0.80 to 0.90 to reflect real-world dirt and lumen depreciation over time. The lumen method gives you a starting point fast, but it only delivers average illuminance across a space-it tells you nothing about uniformity, dark spots, or whether light actually lands where you need it.
Why Point-by-Point Calculations Matter
Point-by-point calculations fix what the lumen method misses by computing illuminance at specific locations, which matters for precision work like assembly lines or detailed retail displays. However, spreadsheet-based point-by-point work is where contractors lose weeks. Manual calculations require you to plot fixture positions, measure distances to each analysis point, apply inverse square law formulas, and account for beam angles from photometric data. One fixture over one point becomes manageable; 20 fixtures across a 100-point grid becomes tedious and error-prone.
The Hidden Costs of Spreadsheet Approaches
Real-world projects fail because someone misread a photometric curve, entered wrong coordinates, or forgot to update maintenance factors when fixture selection changed. The Lighting Research Center emphasizes that contractors must understand fixture light distribution, yet spreadsheets provide no visual feedback until calculations are complete. This lack of real-time verification creates risk at every step.
Moving Beyond Manual Methods
Contractors using Dialux, Relux, or AGI32 software moved past spreadsheets years ago because these tools import photometric data directly, run point-by-point analysis instantly, and show you illuminance maps in real time. The shift away from manual methods isn’t about being fancy-it’s about catching errors before they cost you money on site. Modern platforms eliminate the tedious coordinate entry and formula repetition that consume hours in spreadsheet workflows. As design complexity increases and client expectations for accuracy rise, the tools you choose determine whether you spend time calculating or time designing.
Why Software Matters More Than Your Calculator
Real-Time Illuminance Analysis Replaces Spreadsheet Guesswork
Modern lighting design software eliminates the friction that kills project timelines. Dialux, Relux, and AGI32 import photometric data directly from manufacturers, compute illuminance across hundreds of analysis points simultaneously, and display results as color-coded heat maps instead of spreadsheet cells. A contractor using these tools tests fixture repositioning, swaps luminaire types, and adjusts maintenance factors in seconds-then exports a professional report with measured uniformity ratios and compliance verification against EN12464-1 or EN12193 standards. The speed advantage is real: what takes three hours in a spreadsheet takes fifteen minutes in software, and accuracy improves because you see visual feedback before finalizing anything.
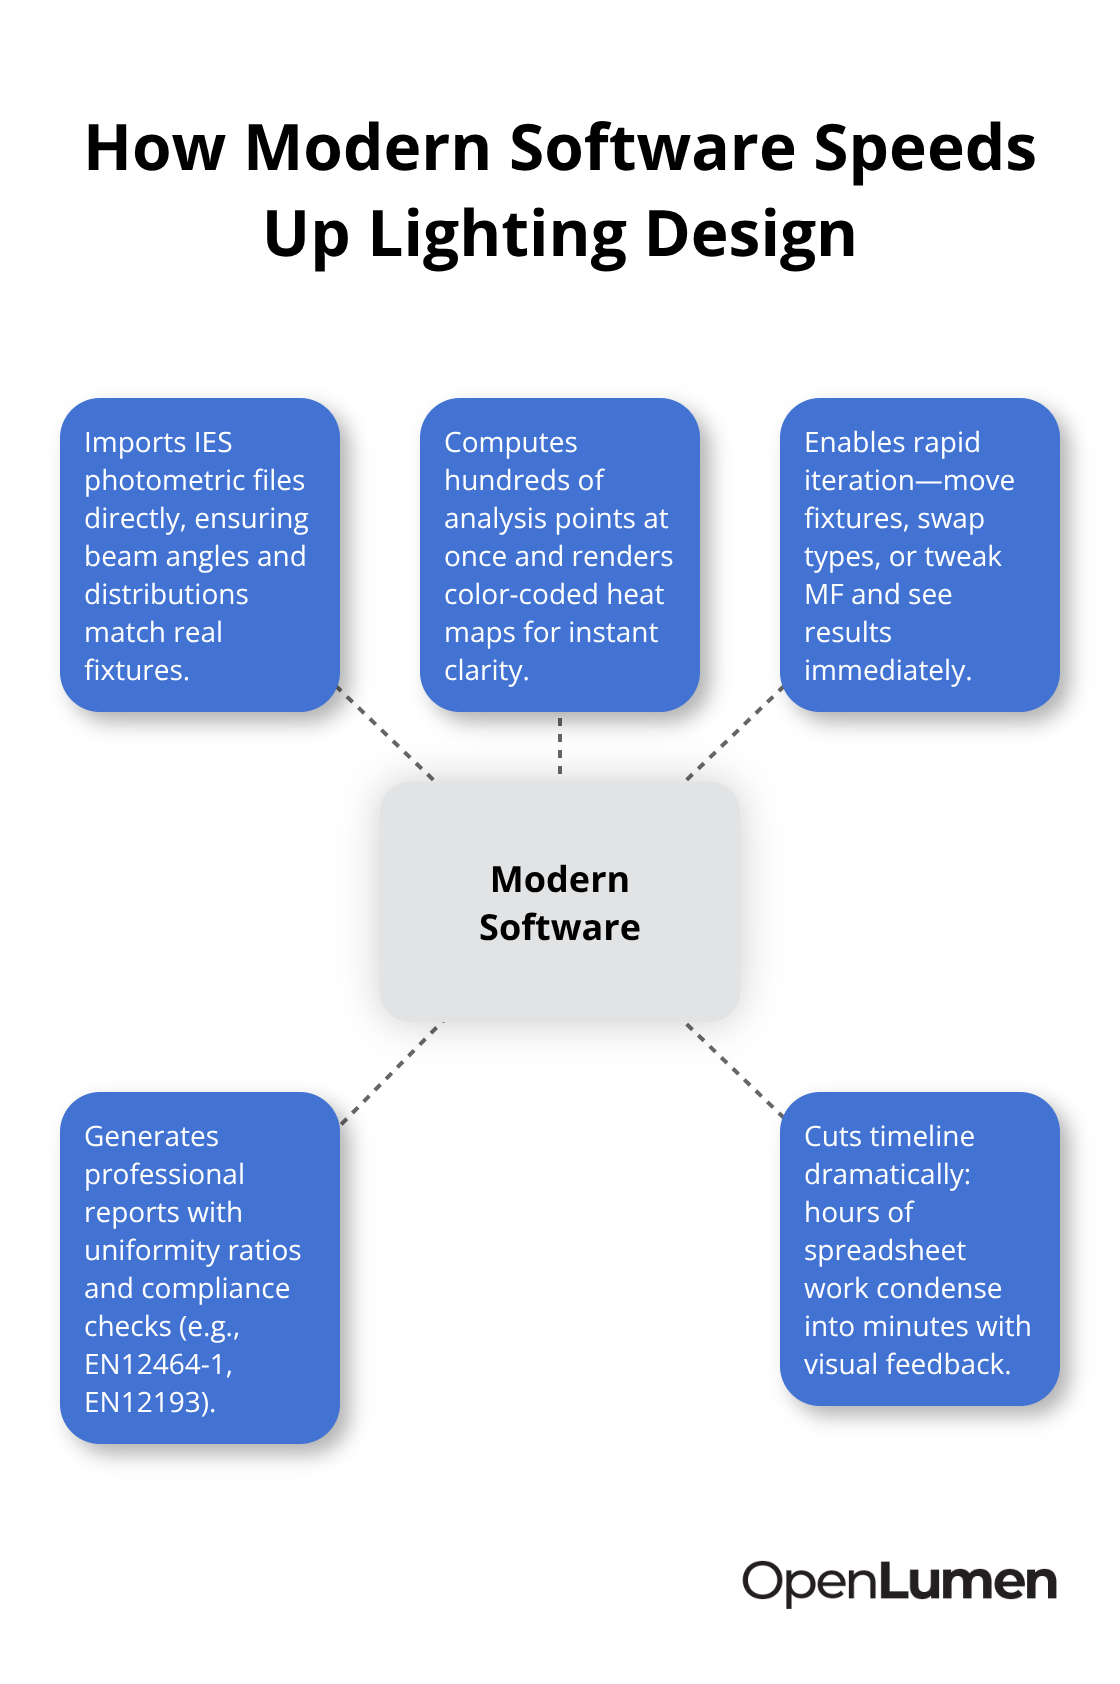
When you adjust a fixture position in Dialux or Relux, the software recalculates illuminance across the entire space instantly and shows you exactly where light levels drop or spike. This immediate feedback catches problems that would otherwise surface on site, where fixing them costs thousands.
Photometric Data Integration Eliminates Manual Transcription Errors
Professional software reads IES photometric files directly from fixture manufacturers instead of requiring manual transcription of inverse square law calculations or beam angles from PDF spec sheets. This eliminates transcription errors and ensures that light distribution curves match the actual product you specify. Two fixtures with identical lumen output but different beam angles produce completely different illuminance patterns, and only accurate photometric data reveals which fixture actually works for your space.
EN12464-1 compliance checks run automatically in these platforms, flagging whether your design meets uniformity requirements or target illuminance levels before you present it to a client.
Browser-Based Platforms Remove Installation Barriers
Browser-based platforms shift this workflow further by removing the installation barrier entirely. Contractors no longer purchase expensive licenses or spend weeks learning desktop software-they log in, upload space dimensions and fixture data, and start designing immediately. OpenLumen offers a free, browser-based alternative that provides instant photometric metrics through its Photometric Hub (polar charts, BUG ratings, zonal lumens data) without hunting through manufacturer websites. For distributors selling lighting systems, this accessibility changes the sales cycle: a distributor generates a professional illuminance report during a customer call rather than promising to send something after consulting an engineer.
Cloud-Based Collaboration Accelerates Project Handoff
Design files live in the cloud, so contractors share layouts with electricians, architects, and clients instantly without compatibility issues or file corruption. When a client requests a design change at midnight, a contractor working in a browser-based platform updates the layout and regenerates the report without waiting for software to load or worrying whether the desktop version has the latest fixture libraries.
This shift toward accessible, real-time tools sets the stage for how contractors actually apply these calculations to real-world projects-where the gap between theory and site performance determines whether a design succeeds or fails.
Applying Calculations to Real-World Projects
Translating Design Requirements into Measurable Outcomes
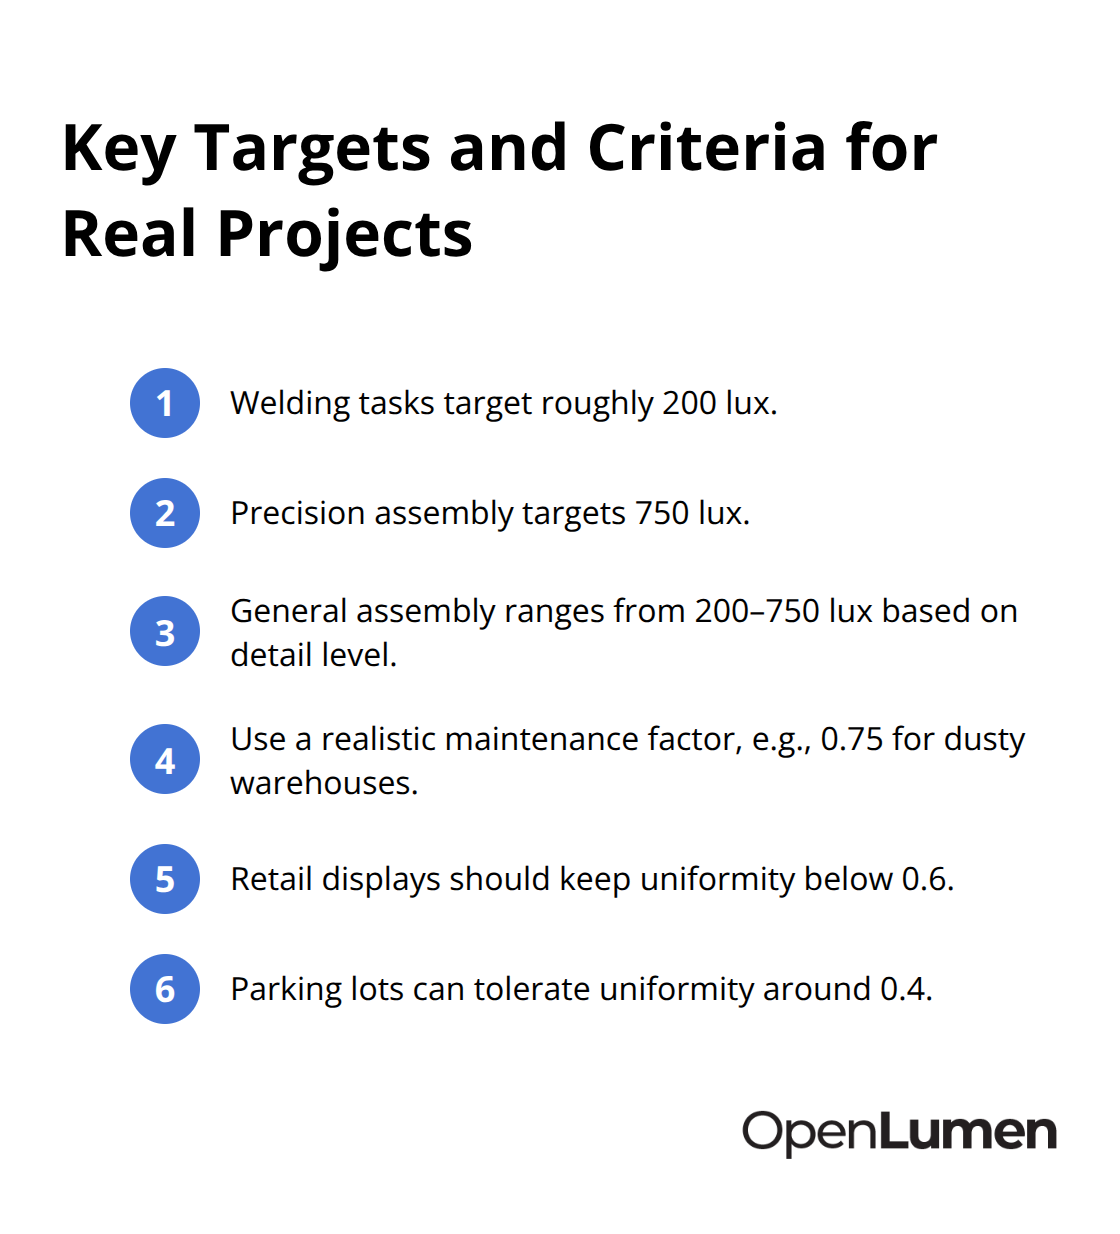
The gap between what your calculations predict and what actually happens on site determines whether clients accept your work or demand corrections. EN12464-1 specifies exact illuminance targets for different tasks-welding needs roughly 200 lux, precision assembly demands 750 lux, and general assembly ranges between 200 and 750 lux depending on detail level.
Hitting these numbers requires you to translate abstract design requirements into specific fixture counts, placements, and maintenance assumptions before installation. Most contractors fail here not because they miscalculate, but because they skip the validation step that confirms their design will perform as promised.
Start with clear acceptance criteria: what uniformity ratio matters for this space, what maintenance factor reflects realistic dirt accumulation in this environment, and which standard governs compliance. A warehouse in a dusty industrial area should use a maintenance factor of 0.75 or lower, not the generic 0.80 that works for clean office spaces. A retail display requires uniformity below 0.6 to avoid visible dark spots, while a parking lot can tolerate 0.4. These specifics determine fixture selection and layout far more than raw lumen output does.
Common Mistakes in Lighting Calculations and How to Avoid Them
Contractors regularly specify fixtures based on lumen ratings alone, ignoring that two 19,000 lumen fixtures with different beam angles produce completely different illuminance patterns in the same space. One contractor specified identical wattage replacements for an assembly area without checking photometric data, only to discover the new fixtures created dark zones where workers couldn’t see detail-costing a full reinstall.
Another mistake is setting maintenance factors too high: assuming 0.90 when realistic conditions warrant 0.75 means your design undershoots targets by 15 percent within two years of operation. Contractors also frequently ignore reflectance values, using generic ceiling and wall reflectances without measuring actual surfaces. A warehouse with aging, dirt-covered ceilings reflects far less light than the 70 percent standard assumption, so your calculated fixture count falls short in practice.
The solution is straightforward: import actual photometric data into your design software, verify uniformity and compliance before presenting to clients, and document your maintenance assumptions so facility managers know when to clean or replace fixtures.
Validation Through Professional Reporting
Professional reports do more than show illuminance maps-they demonstrate that your design meets applicable standards and will perform as specified. EN12464-1 compliance requires you to verify both average illuminance and uniformity ratios at the work plane, so your report must include measured values at specific points, not just overall averages.
When you export from software like Dialux or Relux, include a summary table showing minimum, average, and maximum illuminance across your analysis grid, plus the uniformity ratio (minimum divided by average), so clients and inspectors see exactly what the design delivers. Document your photometric data sources and fixture models so anyone can verify you used the correct light distribution curves.
State your maintenance factor assumption and cleaning interval recommendations explicitly-if you designed for 0.80 maintenance factor with annual cleaning, say so. This transparency prevents disputes when actual performance differs because of neglected maintenance. Browser-based platforms like OpenLumen generate these reports automatically with compliance checks built in, so you skip the manual verification step and present confidence-backed documentation in minutes instead of hours.
Final Thoughts
Your choice of lighting calculation methods directly impacts whether projects deliver on time, within budget, and to specification. Manual spreadsheets and the lumen method still serve quick estimates, but they leave you vulnerable to errors that surface on site where corrections become expensive. Point-by-point analysis catches these problems before installation, yet spreadsheet-based approaches consume hours of tedious work that distracts from actual design decisions.
The contractors winning projects today aren’t those with the best calculators-they’re the ones using tools that eliminate friction and deliver confidence. Clients don’t care how you calculate illuminance; they care that your design meets EN12464-1 standards, delivers the uniformity they need, and performs as promised when fixtures go live. Browser-based platforms remove the barriers that kept lighting design locked behind expensive software licenses and steep learning curves, so distributors generate professional illuminance reports during customer conversations and contractors test design changes in minutes.
Moving forward with confidence means selecting tools that match your workflow, not forcing your workflow around tools. Validate designs before presenting them to clients, document your assumptions clearly, and use photometric data that reflects actual fixture performance. OpenLumen provides instant access to community-verified luminaires, real-time illuminance analysis, and automatic compliance checks-all without installation friction or expensive licenses.
The information provided is for general educational purposes only and should not be considered professional engineering or lighting design advice. Always verify project requirements, local codes, and specifications with qualified professionals before making final decisions.