Industrial lighting calculations often feel overwhelming when you’re scaling from a small office to a warehouse or factory floor. The math gets complex, standards multiply, and one mistake can waste thousands on inefficient layouts.
At OpenLumen, we’ve built tools to strip away that complexity. This guide walks you through the exact methods and software that contractors and facility managers use to get calculations right the first time, at any scale.
Understanding Illuminance Requirements for Different Spaces
Foot-candle targets aren’t guesswork-they’re anchored in real safety and productivity data. The Illuminating Engineering Society publishes specific recommendations by space type, and these numbers matter because they directly affect how many fixtures you’ll need and what your project costs. Warehouse bulk storage requires 10–20 foot-candles, but order-picking areas jump to 30–50 because workers must read labels and barcodes accurately. Manufacturing floors run 30–50 foot-candles for general work, while fine-detail assembly stations demand 50–100 to prevent errors and eye strain. Loading docks sit at 20–30, and quality-control inspection stations push to 100–200 because precision matters.
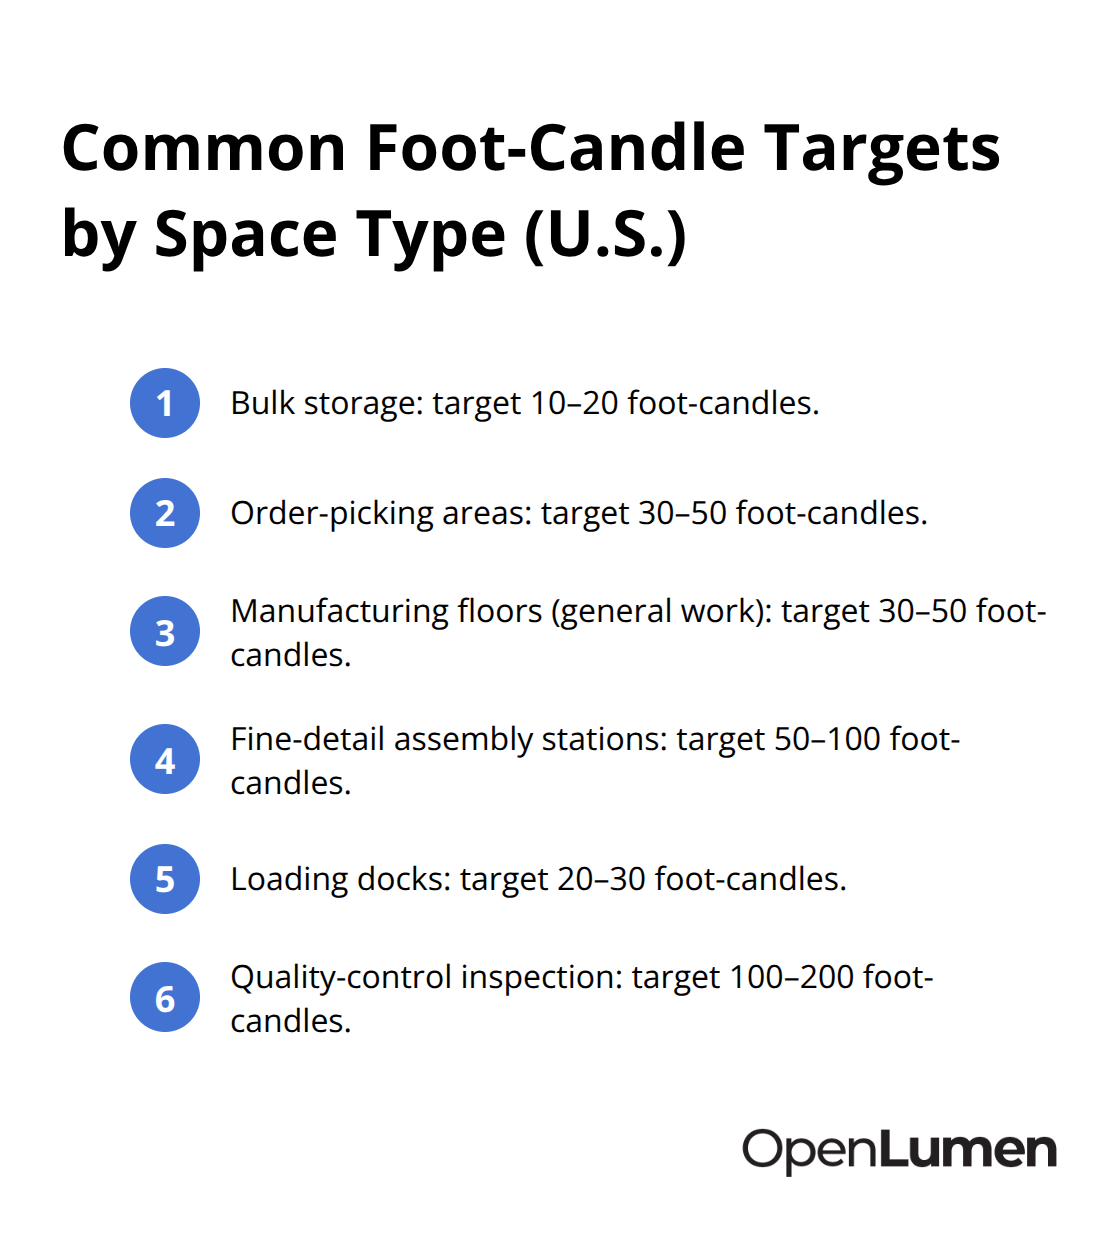
The National Institute for Occupational Safety and Health reports that inadequate lighting contributes to roughly 5 percent of workplace accidents, so hitting these targets isn’t optional-it’s a safety baseline.
Account for Light Loss Over Time
Most facility managers design for initial brightness without accounting for lumen depreciation over time. LEDs lose roughly 20–30 percent of their output over 50,000 hours, which means your 50 foot-candles today becomes 35–40 in three years if you don’t plan ahead. Use a Light Loss Factor between 0.70 and 0.80 for industrial environments to account for this realistic decline and maintain safe, productive light levels throughout the fixture’s life.
Read Standards Correctly to Avoid Costly Gaps
The IES Lighting Handbook and RP-36-15 guidance documents specify foot-candle ranges, but they also include uniformity ratios and quality metrics that many contractors skip. For example, a warehouse needs not just 30 foot-candles on average but also a maximum-to-minimum ratio no worse than 4:1, meaning your brightest spot shouldn’t exceed four times the brightness of your darkest. This uniformity requirement directly influences how many fixtures you need and where you place them. Ceiling height and surface reflectance are the two biggest variables that shift your calculations by 20–40 percent. A 30-foot ceiling requires significantly more powerful fixtures or more units than a 15-foot one because light spreads over a larger area-the inverse square law means doubling your mounting height cuts foot-candles by about 75 percent. Dark walls and floors (reflectance below 30 percent) absorb light and force you to add fixtures; bright ceilings above 80 percent reflectance bounce light back down and reduce your fixture count. The U.S. Department of Energy reports that strategic lighting design cuts industrial energy use by 25–60 percent, so these calculations directly affect your operating budget for decades.
Avoid the Simplified Formula Trap
Many online calculators use lumens per square foot alone and ignore the Coefficient of Utilization and Light Loss Factor, which causes them to underestimate required fixtures by 30–50 percent over the project life. A high-bay warehouse using only lumens-per-square-foot math might specify 80 fixtures when the correct calculation demands 102. That shortfall means inadequate light, worker complaints, safety gaps, and retrofit costs.
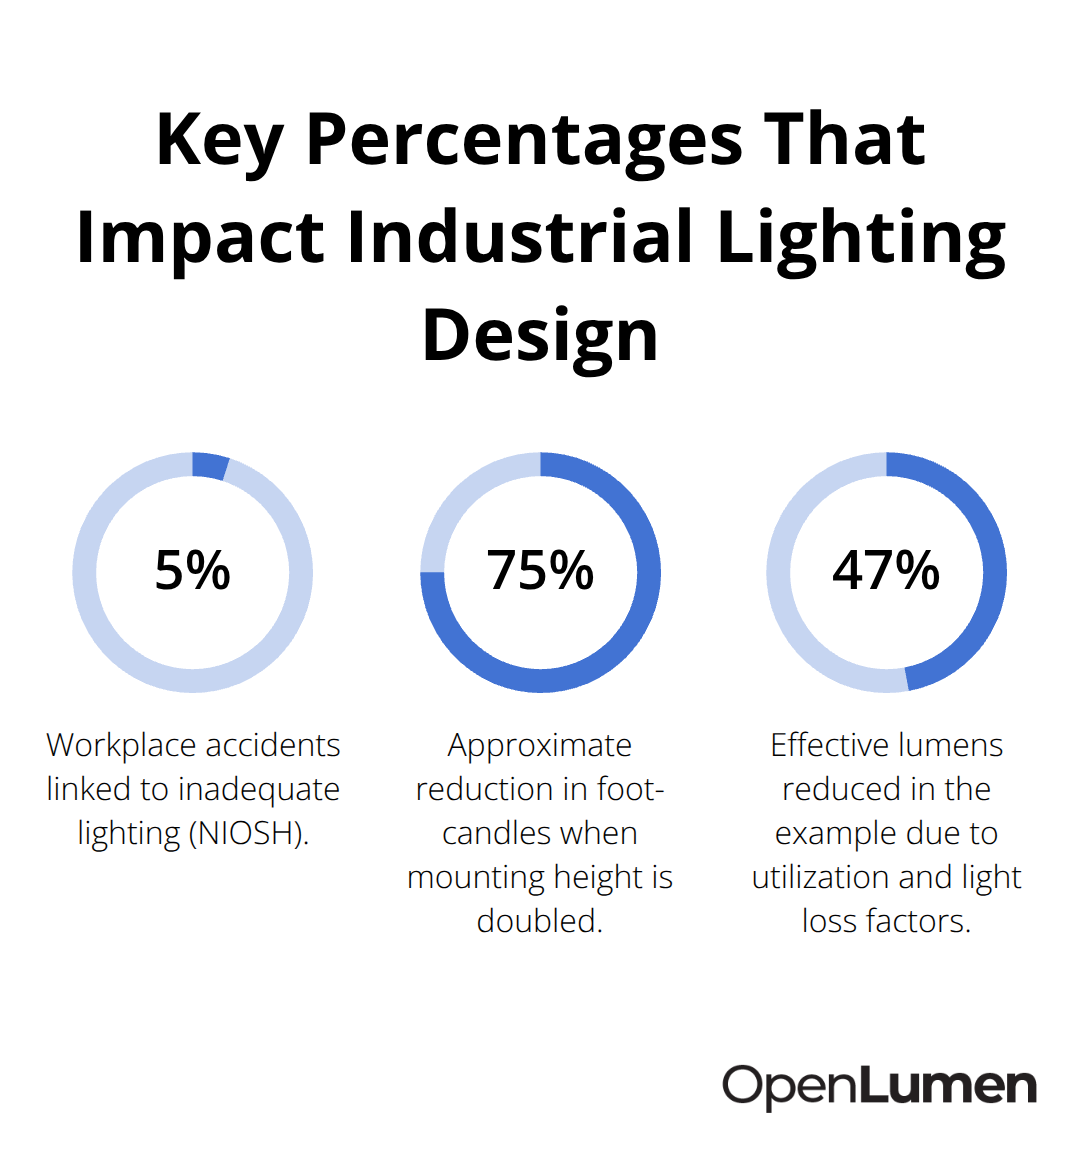
The correct formula is Number of Fixtures equals (Target foot-candles multiplied by Area) divided by (Lumens per Fixture multiplied by Coefficient of Utilization multiplied by Light Loss Factor). For a typical warehouse high bay with 0.62 utilization and 0.85 light loss, those two factors alone reduce the effective lumens reaching the work plane by 47 percent. Always pull luminaire lumens from the photometric report, never from the lamp label-a fixture rated 28,000 lumens might deliver only 26,000 after optics and ballast losses. At scale, this difference across hundreds of fixtures compounds into real money wasted on oversized or undersized installations.
Once you nail down your foot-candle targets and account for real-world losses, the next challenge is predicting how light actually spreads across your space. That’s where photometric data and surface reflectance become your competitive advantage.
How Light Actually Spreads Across Your Space
Photometric Data Reveals What Lumen Ratings Hide
Photometric data forms the bridge between your foot-candle target and real fixture placement. Most contractors grab a fixture’s lumen rating and stop there, but that number alone tells you almost nothing about how light distributes across your floor. A 28,000-lumen high bay with a narrow 60-degree beam concentrates light in a tight circle, creating bright hotspots and dark gaps. The same 28,000 lumens in a 120-degree wide beam spreads evenly but drops foot-candles significantly at distance. The IES file-the photometric report that comes with every quality fixture-contains the polar chart showing exactly how many candelas (intensity) the fixture delivers at each angle. Without this data, your layout becomes a liability.
When you pull the IES file into a photometric calculator or simulation software, you input your room dimensions, mounting height, and fixture spacing. The tool then runs point-by-point calculations across the work plane. A 50,000-square-foot warehouse at 30 foot-candles doesn’t need uniform spacing everywhere; your calculation software shows you where 25 foot-candles is acceptable (bulk storage aisles) and where you must hit 50 (picking zones).
Surface Reflectance Changes Your Fixture Count by Thousands of Dollars
Surface reflectance multiplies this complexity because it directly affects how much light reaches the work plane. The Coefficient of Utilization-a factor between 0.40 and 0.80 that appears in your fixture calculation-changes based on ceiling height, wall color, and floor material. A warehouse with dark concrete walls at 30 percent reflectance and a painted ceiling at 80 percent has a utilization factor around 0.62; the same room with light gray walls at 70 percent jumps to 0.70 or higher. That 8-point swing means the difference between 102 fixtures and 94 fixtures across your entire space-roughly $8,000 to $12,000 in material and labor. Measure or specify your actual wall and ceiling colors before calculating; dark finishes aren’t just aesthetic choices, they’re cost multipliers.
Scaling Demands Precision Because Errors Compound Across Large Areas
Scaling from a small office to a factory demands discipline because the errors compound. A 10,000-square-foot office at 40 foot-candles with 5,000-lumen troffers and a 9-foot ceiling needs about 131 fixtures in an 8-by-10-foot grid if you ignore reflectance and losses; the correct calculation accounting for a 0.68 utilization factor and 0.90 light loss factor still demands roughly 131 troffers, so the math checks out for smaller, indoor spaces. Now scale that to a 50,000-square-foot warehouse with 30-foot ceilings and high bays rated 28,000 lumens. A simplified lumens-per-square-foot approach suggests roughly 75 fixtures; the correct formula using 0.62 utilization, 0.85 light loss, and the actual photometric data demands 102 fixtures. That 36-percent gap isn’t rounding error-it’s the difference between a dark, unsafe warehouse and a compliant one.
The U.S. Department of Energy research shows that poor lighting layouts waste 25 to 35 percent of fixture investment through over-specification in some zones and under-specification in others. Professional photometric simulation tools let you visualize the actual foot-candle contours across your floor before you buy a single fixture. You see where uniformity fails, where glare concentrates, and where you’re spending money on unnecessary brightness. Most contractors resist this step because it feels like extra work, but running a 3D photometric layout on a 50,000-square-foot project takes 20 to 30 minutes and prevents retrofit costs that run into six figures.
Ceiling Height Drives the Entire Calculation
Ceiling height is the single largest variable in scaling calculations because of the inverse square law; a 15-foot ceiling warehouse and a 30-foot one with identical floor area need completely different fixture counts and lumen outputs. Always run your calculation at the actual mounting height, not an assumed average, because the difference in foot-candles at the work plane (typically 3 feet above the floor) is dramatic. Once you’ve mapped your photometric layout and confirmed your fixture placement, the next step is choosing the right tool to automate these calculations and generate reports that your team can trust and share.
Tools and Methods for Fast, Accurate Calculations
Browser-Based Platforms Replace Manual Spreadsheets
Manual calculations work for small spaces, but they collapse at scale. A 10,000-square-foot office requires roughly 131 fixtures; calculating that by hand takes hours and introduces arithmetic errors. A 50,000-square-foot warehouse demands 102 fixtures with precise placement, and manual spreadsheets become a liability because you cannot visualize the actual foot-candle contours or adjust layouts in real time. Browser-based photometric platforms eliminate this friction entirely. These tools accept your room dimensions, ceiling height, mounting height, and fixture selection, then run point-by-point illuminance calculations across the entire work plane in seconds. You see foot-candle values at every coordinate, uniformity ratios, power density, and heat maps showing where light concentrates and where gaps form. This instant feedback lets you adjust fixture spacing, swap luminaire models, or test different ceiling heights without recalculating formulas or rebuilding spreadsheets.
Instant Metrics Validate Fixture Performance
Photometric data validation happens in real time on modern platforms. The Photometric Hub metrics appear instantly-polar charts, zonal lumens, and BUG ratings-so you validate fixture performance without opening separate tools or requesting data sheets. Most contractors report that moving from spreadsheets to browser-based platforms cuts calculation time by 60 to 75 percent while improving accuracy because the software enforces the Coefficient of Utilization and Light Loss Factor automatically, preventing the 30 to 50 percent fixture-count errors that plague simplified formulas.
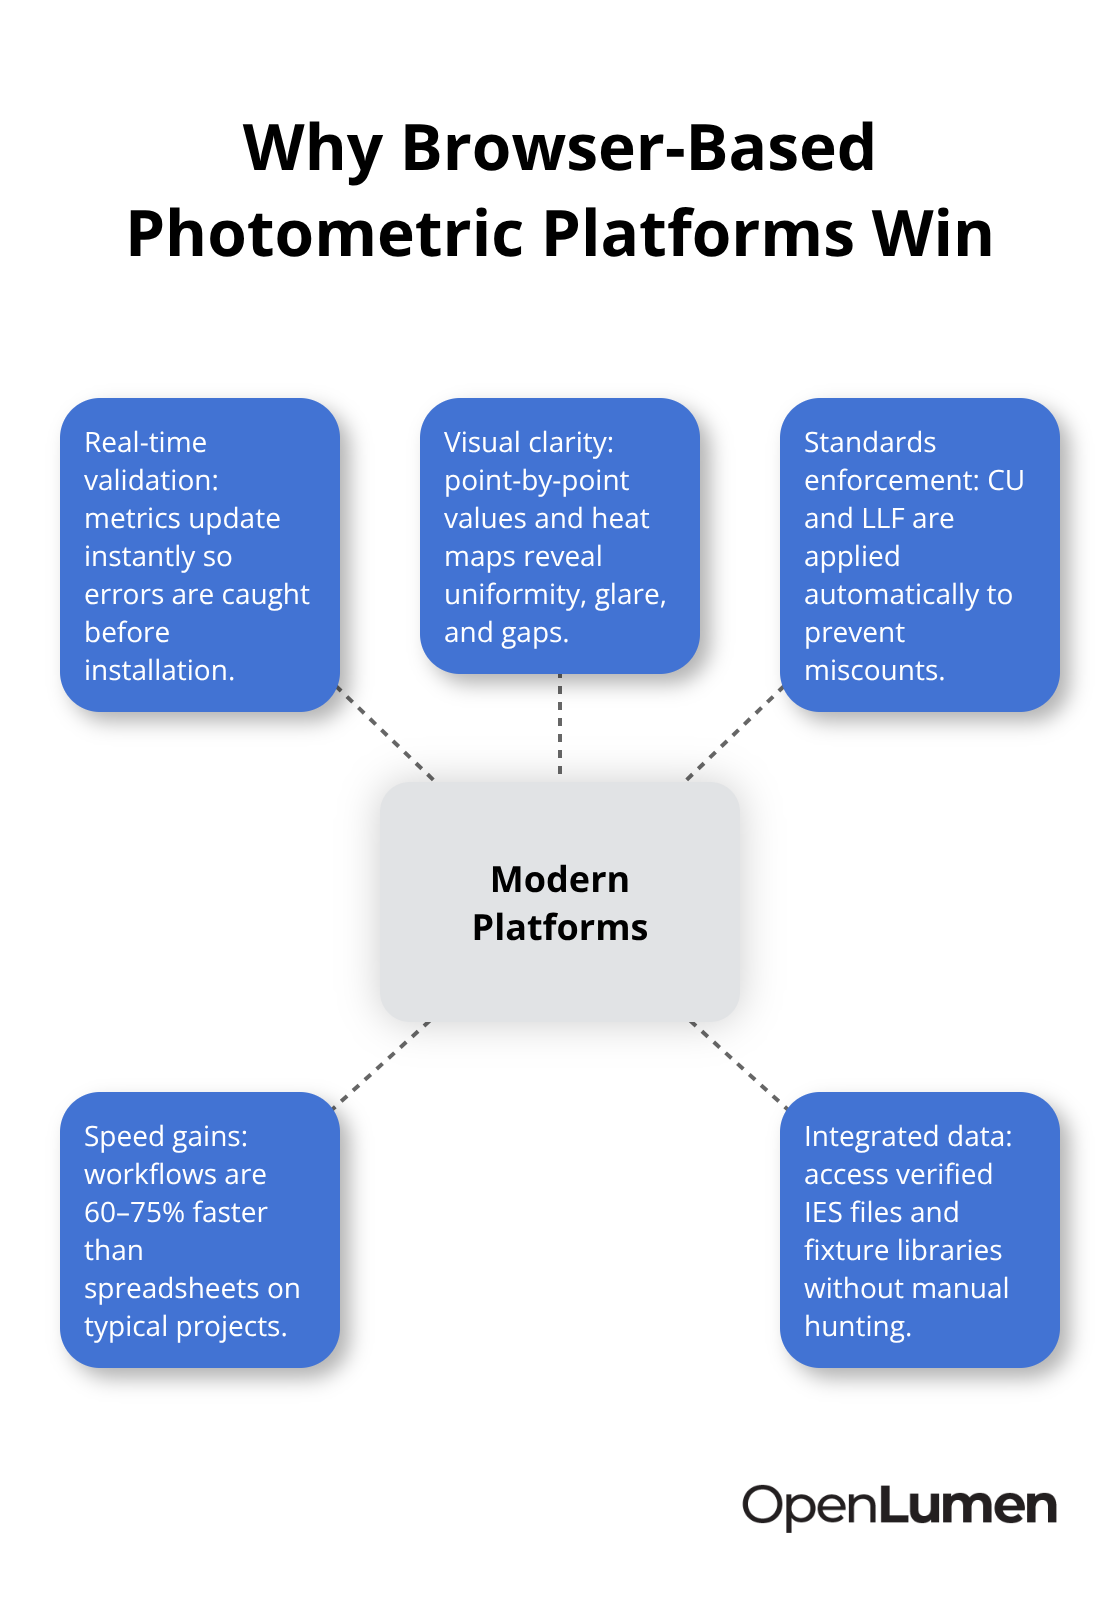
A platform that pulls real photometric data from thousands of verified luminaires eliminates the manual IES file hunting that wastes contractor time.
Reports and Automation Accelerate Project Approval
A browser platform generates professional layouts, illuminance tables, power-density summaries, and material lists that you export as PDF or share directly with clients and installers. Manual calculations require you to format data, create tables, and compile reports manually, which introduces transcription errors and delays project approval. The best platforms also let you store designs, duplicate them for similar spaces, and build template libraries so a 30,000-square-foot warehouse retrofit does not start from zero. A 3D visualization showing foot-candle contours across the floor convinces stakeholders faster than a spreadsheet; facility owners see exactly where 50 foot-candles lands and why you specified that fixture count, eliminating scope creep and change orders.
Validation Catches Errors Before Installation
Automation also catches mistakes before installation-if your layout produces an average of 28 foot-candles instead of the required 30, the software flags it immediately rather than forcing a retrofit after fixtures mount. This validation step alone saves contractors tens of thousands in rework costs across a year of projects. Software enforces standards compliance and prevents the costly oversights that manual methods allow to slip through.
Final Thoughts
Industrial lighting calculations at scale demand precision, but they don’t require guesswork or endless spreadsheets. The core principle remains simple: foot-candle targets drive fixture counts, photometric data reveals how light actually spreads, and real-world factors like reflectance and light loss determine whether your design succeeds or fails. When you account for the Coefficient of Utilization and Light Loss Factor from the start, you avoid the 30 to 50 percent fixture-count errors that plague simplified formulas, and a 50,000-square-foot warehouse calculated correctly costs thousands less to install and operate than one designed with lumens-per-square-foot shortcuts.
Accurate industrial lighting calculations save time and money because they prevent retrofits, eliminate worker complaints about inadequate lighting, and ensure your design meets safety standards on the first installation. A photometric layout that takes 20 to 30 minutes to run prevents retrofit costs that run into six figures, and professional reports generated from real photometric data accelerate client approval because stakeholders see exactly where foot-candles land and why you specified that fixture count. The shift from manual spreadsheets to browser-based platforms has fundamentally changed how contractors and facility managers approach scaling, as these tools enforce standards compliance, validate fixture performance in real time, and generate professional layouts that convince stakeholders faster than tables and numbers alone.
Start your next project by defining your foot-candle targets based on IES standards for your specific space type, then pull the actual photometric data for your chosen fixtures. Account for ceiling height, surface reflectance, and light loss from the beginning, and use a photometric platform to run your layout, validate uniformity, and generate reports that your team can trust. This disciplined approach scales from a 10,000-square-foot office to a 100,000-square-foot factory without adding complexity or risk.
The information provided is for general educational purposes only and should not be considered professional engineering or lighting design advice. Always verify project requirements, local codes, and specifications with qualified professionals before making final decisions.