Most lighting designers spend hours fixing mistakes that could have been prevented with a solid photometric layout from the start. Creating photometric layouts correctly saves time, reduces installation surprises, and keeps projects on budget.
At OpenLumen, we’ve seen how the right process transforms design confidence and cuts rework by half. This guide walks you through each step, from site data to ready-to-install plans.
What Photometric Layouts Actually Do
The Core Function of Photometric Layouts
A photometric layout is a computer-generated simulation that shows exactly where light will land, how bright it will be, and how evenly it will distribute across a space before you install a single fixture. It calculates foot-candle readings at specific points, identifies dark spots, and reveals whether your design meets code requirements or customer expectations. This isn’t theoretical-it’s a precise prediction of real-world performance based on fixture specifications, mounting heights, aiming angles, and surface reflectance values.
Meeting Application-Specific Illumination Targets
Warehouses typically need 20 to 50 foot-candles depending on task type, while retail spaces often demand 50 to 100 foot-candles to highlight products effectively. A photometric layout tells you exactly how many fixtures you need, where they go, and what wattage each one requires to hit those targets. Without this simulation, you’re essentially guessing, and guessing costs money.
How Photometric Layouts Protect Your Timeline and Budget
Contractors who skip photometric layouts often discover mid-project that coverage is uneven, dark zones exist in critical areas, or they’ve oversized the system and wasted energy. These mistakes typically add 2 to 4 weeks to projects and trigger expensive fixture relocations or additional purchases. Teams that validate designs before installation cut rework by roughly 50 percent.
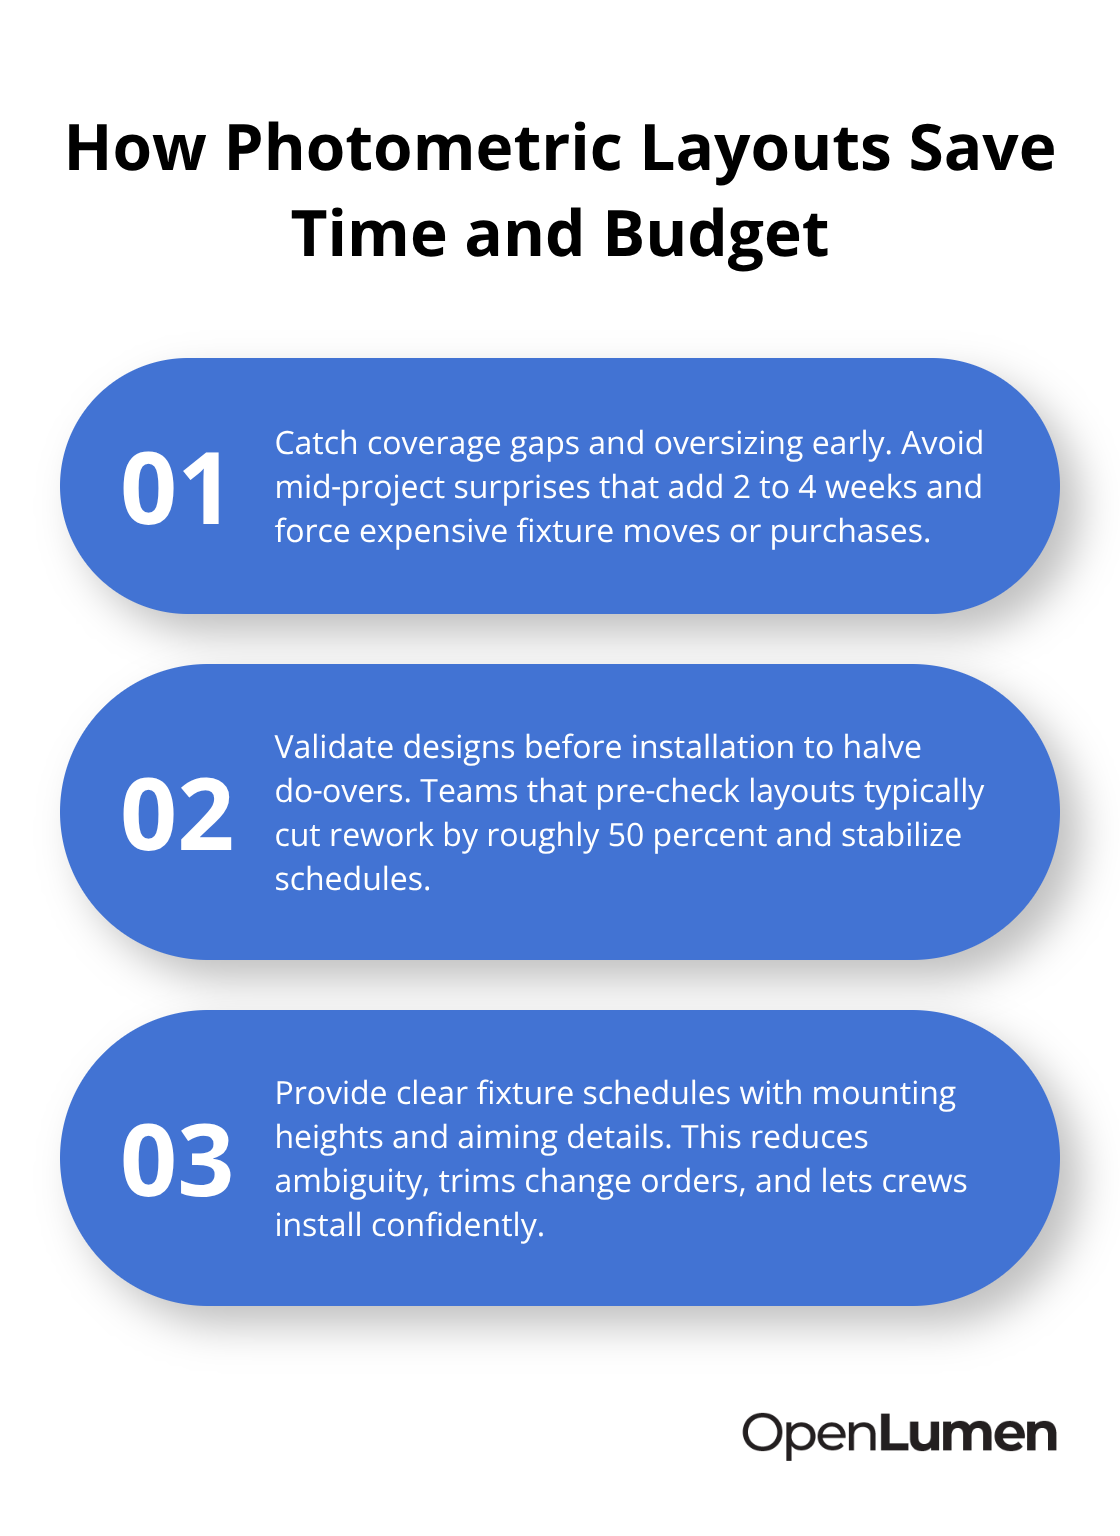
Property owners benefit too-a proper photometric layout prevents the frustration of paying for a lighting system that doesn’t perform as promised. Code compliance becomes straightforward because your layout includes uniformity ratios and illuminance metrics that jurisdictions require. You hand the installation team a fixture schedule with exact mounting heights, aiming details, and lumen packages, eliminating ambiguity on site. This clarity reduces coordination delays, minimizes change orders, and lets crews install with confidence rather than improvisation.
What Happens Next
The real power of a photometric layout emerges when you know how to build one correctly. The next section walks you through the exact steps-from collecting site data to validating results-so you can create layouts that contractors trust and projects that stay on schedule.
Building Your Photometric Layout From Site Data to Fixture Placement
Collect Site Data and Define Lighting Targets
Collect the exact dimensions of your space, mounting heights for fixtures, and surface reflectance values for floors, walls, and ceilings. If you work indoors, measure the reflectance of materials directly-a concrete floor reflects roughly 20 to 30 percent of light, while painted drywall typically reflects 50 to 70 percent. Outdoor spaces require site photos, terrain data, and information about obstructions like trees, buildings, or overhangs that will block or redirect light. Many contractors skip reflectance values and pay for it later when actual illumination falls 15 to 25 percent short of predictions.
Next, define your lighting targets in foot-candles based on the application. Warehouses with detailed tasks like picking need 50 foot-candles minimum, while general warehouse areas function at 20 to 30 foot-candles. Retail spaces demand 75 to 100 foot-candles on merchandise displays to drive customer attention, though circulation areas can operate at 30 to 50 foot-candles. Parking lots require 0.5 to 1.5 foot-candles average with a uniformity ratio no worse than 4 to 1 to prevent dark and bright zones that confuse drivers.
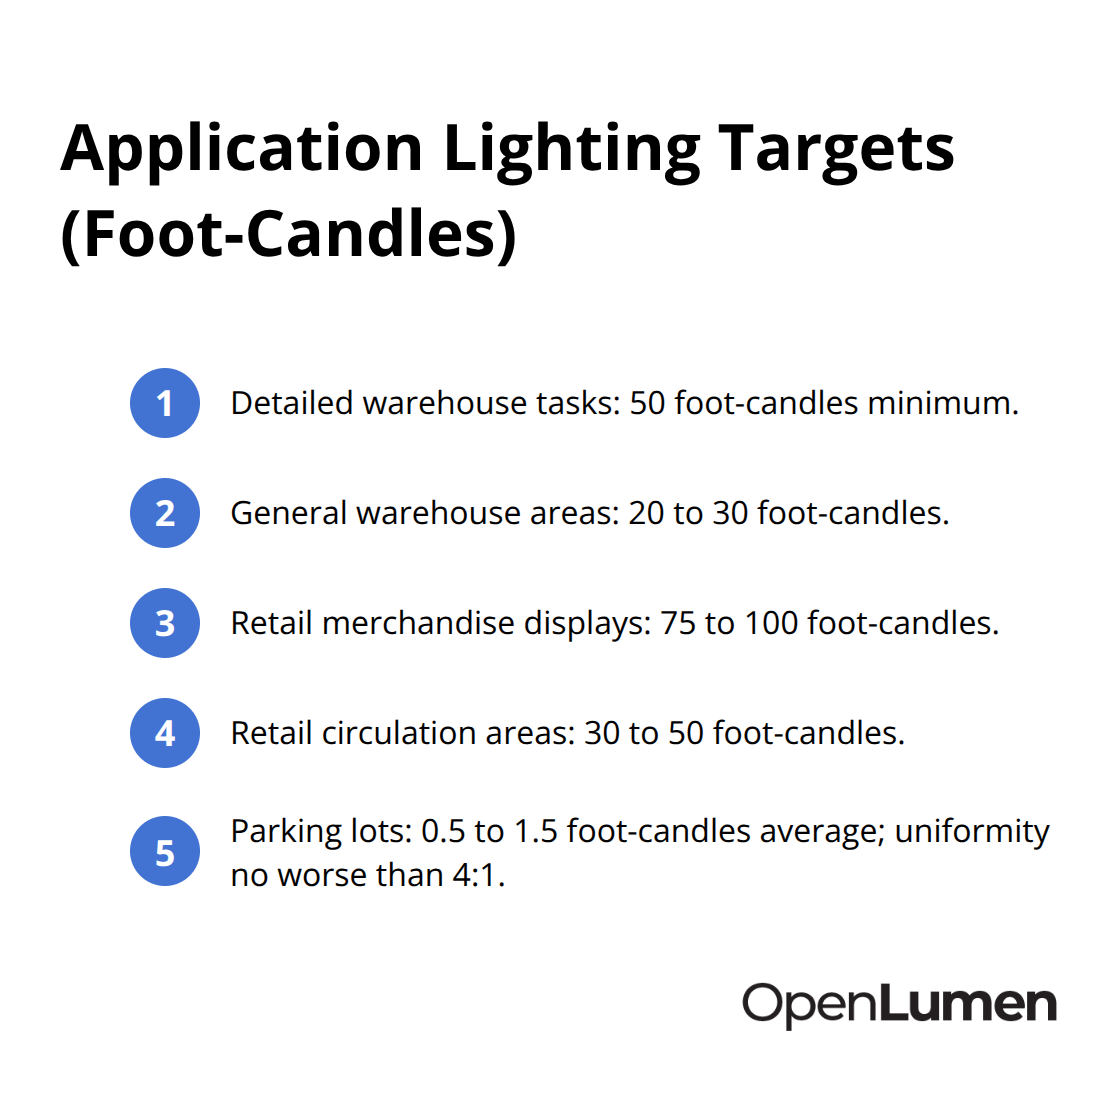
Document these requirements before you touch fixture selection-this step prevents wasted time testing wrong luminaires later.
Select Fixtures and Position Them Strategically
Fixture selection depends on your light distribution requirements, color temperature preference, and control needs. A narrow-beam fixture works well for accent lighting or highlighting specific zones, while a wide-beam fixture spreads light across larger areas but may create glare if mounted too low. Test multiple fixture types in your photometric software to compare foot-candle results, uniformity ratios, and energy consumption. A 100-watt narrow-beam fixture might deliver the same foot-candle reading as a 150-watt wide-beam option, but the narrow beam creates hotspots and dark zones while the wide beam distributes evenly.
Position fixtures using a calculation grid-typically spaced at 1-foot or 2-foot intervals depending on space size-so you see illuminance at points where it matters most, like workstations or merchandise displays. Mounting height and aiming angle are critical: raising a fixture by 2 feet reduces peak brightness directly below it but improves overall uniformity. Spacing fixtures too far apart creates dark zones between them; spacing them too close wastes money and creates overlapping brightness that exceeds your target. Most software platforms let you adjust fixture spacing instantly and see updated foot-candle readings, so iterate until uniformity and energy efficiency align with your goals. This iterative approach typically takes 30 to 60 minutes per space, far faster than installing fixtures and discovering problems on site.
Validate Results and Prepare for Installation
Run your illuminance analysis and review three critical metrics: average foot-candles across the space, minimum and maximum values, and uniformity ratio. A uniformity ratio is calculated as maximum foot-candles divided by minimum foot-candles-lower ratios mean more even light distribution. If your average is 50 foot-candles but your minimum is 10 and maximum is 120, your uniformity ratio is 12 to 1, which creates visible bright spots and dark zones that customers and workers notice immediately. Try for uniformity ratios below 4 to 1 in retail and office spaces, and below 6 to 1 in warehouses where task precision matters less.
Export your photometric plan as a PDF report that includes the fixture schedule with exact model numbers, mounting heights, aiming angles, lumen packages, wattage, and color temperature. This schedule becomes your installation instruction-crews follow it precisely rather than improvising on site. Many software platforms also generate isolines on your site plan that highlight critical illuminance levels, showing you exactly where 50-foot-candle zones exist and where dark areas remain. If your analysis reveals a dark corner or uneven coverage, adjust fixture placement or swap to a higher-lumen fixture and recalculate immediately. This validation step catches problems that would cost thousands to fix after installation, and it takes minutes when you use the right tools.
The next section reveals the mistakes that derail even experienced teams-and how to spot them before they damage your timeline and budget.
Three Critical Oversights That Cost Projects Time and Money
Photometric software delivers precise predictions, but only if you feed it accurate data. Most teams understand fixture placement and foot-candle targets, yet they still stumble on three overlooked factors that collapse even well-intentioned designs.
Account for Maintenance Factor and Light Degradation
Maintenance factor represents how much light output degrades over time as fixtures accumulate dust, lamps dim, and reflective surfaces darken. A new LED fixture in a warehouse delivers full brightness on day one, but after 12 months of operation in a dusty environment, actual output drops 15 to 25 percent below your photometric predictions. If your layout assumes 100 percent maintenance factor and you target exactly 50 foot-candles, the space will deliver only 40 foot-candles after a year, leaving workers struggling with inadequate light.
IES standards recommend applying a maintenance factor of 0.7 to 0.9 depending on environmental conditions and cleaning schedules, meaning your photometric layout should target 55 to 71 foot-candles to account for this decline. Warehouses with high dust loads, outdoor parking lots exposed to weather, and industrial spaces with chemical fumes all demand aggressive maintenance factors. Teams that skip this step inevitably receive complaints six months after installation, triggering expensive fixture upgrades or retrofit work that could have been prevented with honest design assumptions.
Measure Surface Reflectance Values in Your Actual Space
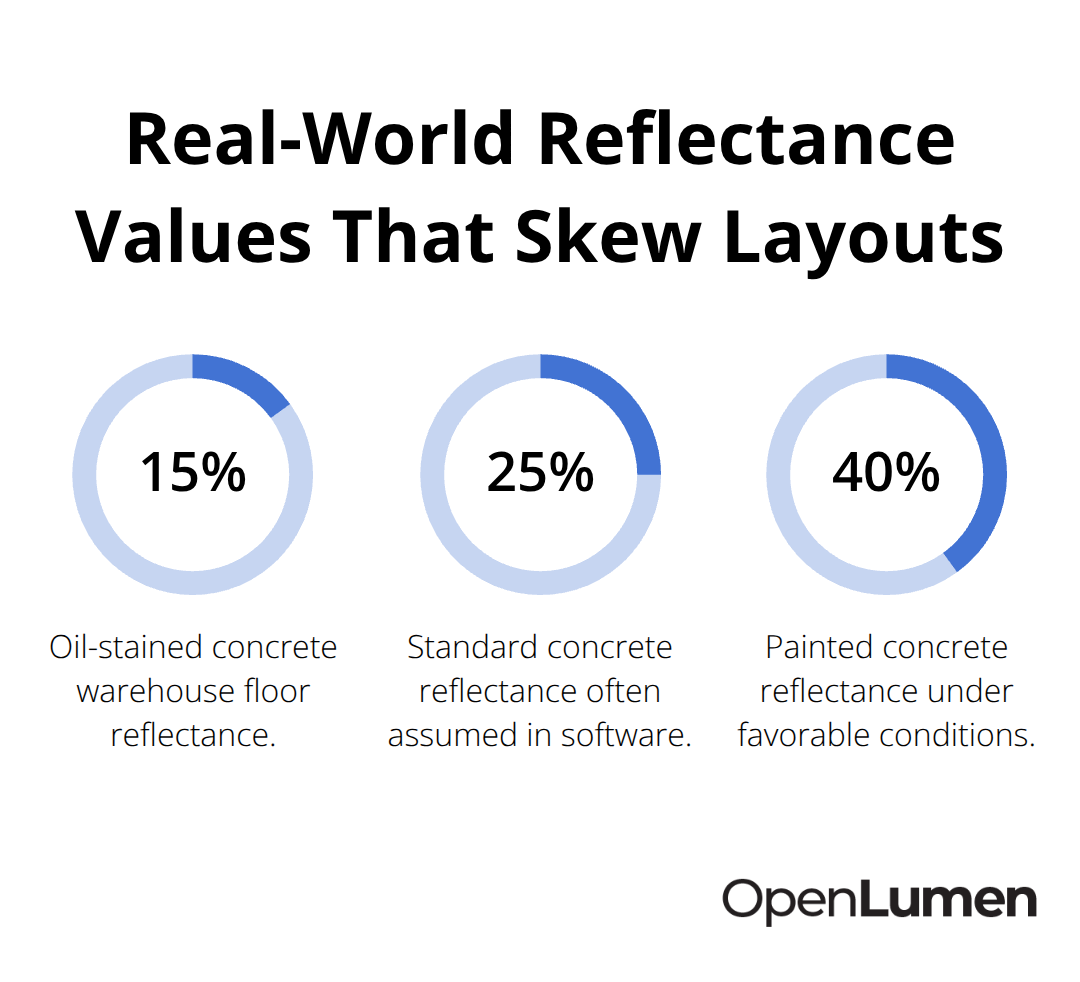
Surface reflectance values control whether your photometric layout matches what actually happens on site. Most teams grab generic reflectance numbers from industry standards without measuring the actual materials in their space. A concrete warehouse floor with oil stains reflects closer to 15 percent, not the standard 25 percent. Aged drywall in a retail space reflects 35 to 45 percent, not the clean 60 percent your software assumes.
These differences compound across a large space, and a 10 percent variance in reflectance translates directly into 10 percent variance in foot-candle readings. Outdoor spaces introduce even more complexity: asphalt reflects 7 to 10 percent, while gravel reflects 20 to 25 percent, and painted concrete can reach 40 percent depending on age and maintenance. If your parking lot design assumes average reflectance and you’re actually working with worn asphalt, your layout will overestimate coverage by 20 to 30 percent, leaving dark zones where drivers expect safety.
Measure reflectance values with a simple light meter or photograph the actual surfaces and request reflectance data from manufacturers. When you cannot measure directly, use conservative estimates and test your design with lower reflectance values to ensure performance even if conditions degrade. Environmental factors like snow accumulation in northern climates, salt spray corrosion in coastal areas, and seasonal vegetation changes in landscaping projects all shift reflectance and light distribution. Building these variables into your initial layout prevents the frustration of installing a system that performs differently than promised.
Verify Your Layout With Installation Teams Before Site Work Begins
The handoff to installation teams represents your last chance to catch errors without paying for costly fixes. Too many designers export their photometric plan and assume the work is done, but installation crews often encounter site conditions that differ from drawings, obstructions that block sightlines, or fixture specifications that don’t match the actual products available.
Walk through your photometric layout with the installation team before they leave the office, point out the exact mounting heights and aiming angles, and discuss any site challenges that might affect performance. If your plan shows fixtures mounted at 15 feet but the installation location has a 12-foot clearance, you’ve created a problem that requires redesign. If your layout assumes a clear sight line between a fixture and a work area but a structural column blocks that path, your foot-candle predictions evaporate.
Many contractors discover these conflicts on site and either improvise a fix that degrades performance or call back to the design team, adding weeks to the project timeline. Request that crews photograph the site before and after installation, and compare those photos against your photometric plan. Dark spots that appear in the actual photos but didn’t show up in your layout signal a disconnect between assumptions and reality. This verification step takes 30 minutes and prevents 2 to 4 weeks of rework and customer dissatisfaction.
Conclusion
Creating photometric layouts correctly transforms how teams approach lighting design and eliminates guesswork that leads to costly installation surprises. When you collect accurate site data, validate surface reflectance values, account for maintenance factor, and verify designs with installation crews before work starts, you stop paying for rework and build reputation for reliability. Digital tools accelerate this workflow dramatically-instead of waiting weeks for external consultants, modern platforms let you test multiple configurations in minutes and generate professional reports ready for code compliance.
The real competitive advantage belongs to teams that treat photometric layouts as standard practice rather than optional extras. Contractors who hand installation crews a precise fixture schedule with exact mounting heights and aiming angles eliminate coordination delays and change orders. Distributors who offer photometric validation to customers win larger projects and reduce post-installation complaints, while property owners who invest in proper design upfront avoid the frustration of paying for systems that underperform.
Start by adopting one simple habit: never hand off a lighting project to installation without a validated photometric plan. Tools like OpenLumen make the process fast and accessible, with community-verified luminaires and instant analysis metrics that let you design, validate, and generate reports without expensive software or steep learning curves. The time you invest in creating photometric layouts pays back immediately through faster installations, fewer callbacks, and projects that stay on schedule.
The information provided is for general educational purposes only and should not be considered professional engineering or lighting design advice. Always verify project requirements, local codes, and specifications with qualified professionals before making final decisions.