BUG ratings directly control how light spreads from your fixtures-and most designers ignore them until problems appear on site. At OpenLumen, we’ve seen projects delayed and budgets stretched because teams didn’t understand photometric data quality upfront.
This guide gives you practical BUG rating tips to read charts correctly, compare fixtures accurately, and avoid costly mistakes during the design phase.
Understanding BUG Ratings and How They Control Light Distribution
What BUG Ratings Actually Tell You
BUG stands for Backlight, Uplight, and Glare-defined by the IES TM-15-11 standard-and each rating measures where light leaves your fixture in specific angle zones. Backlight (B) captures light directed behind the fixture from 0 to 80 degrees, Uplight (U) measures light above the horizontal from 90 to 180 degrees, and Glare (G) quantifies high-angle brightness from 60 to 90 degrees. These aren’t abstract numbers; they predict real-world problems with precision.
A fixture with high backlight spills onto neighboring properties and triggers light trespass complaints. High uplight drives skyglow that erases star visibility and disrupts wildlife-the International Dark-Sky Association identifies uplight as the primary culprit in astronomical light pollution. High glare creates uncomfortable brightness that reduces visual comfort and safety for pedestrians and drivers.
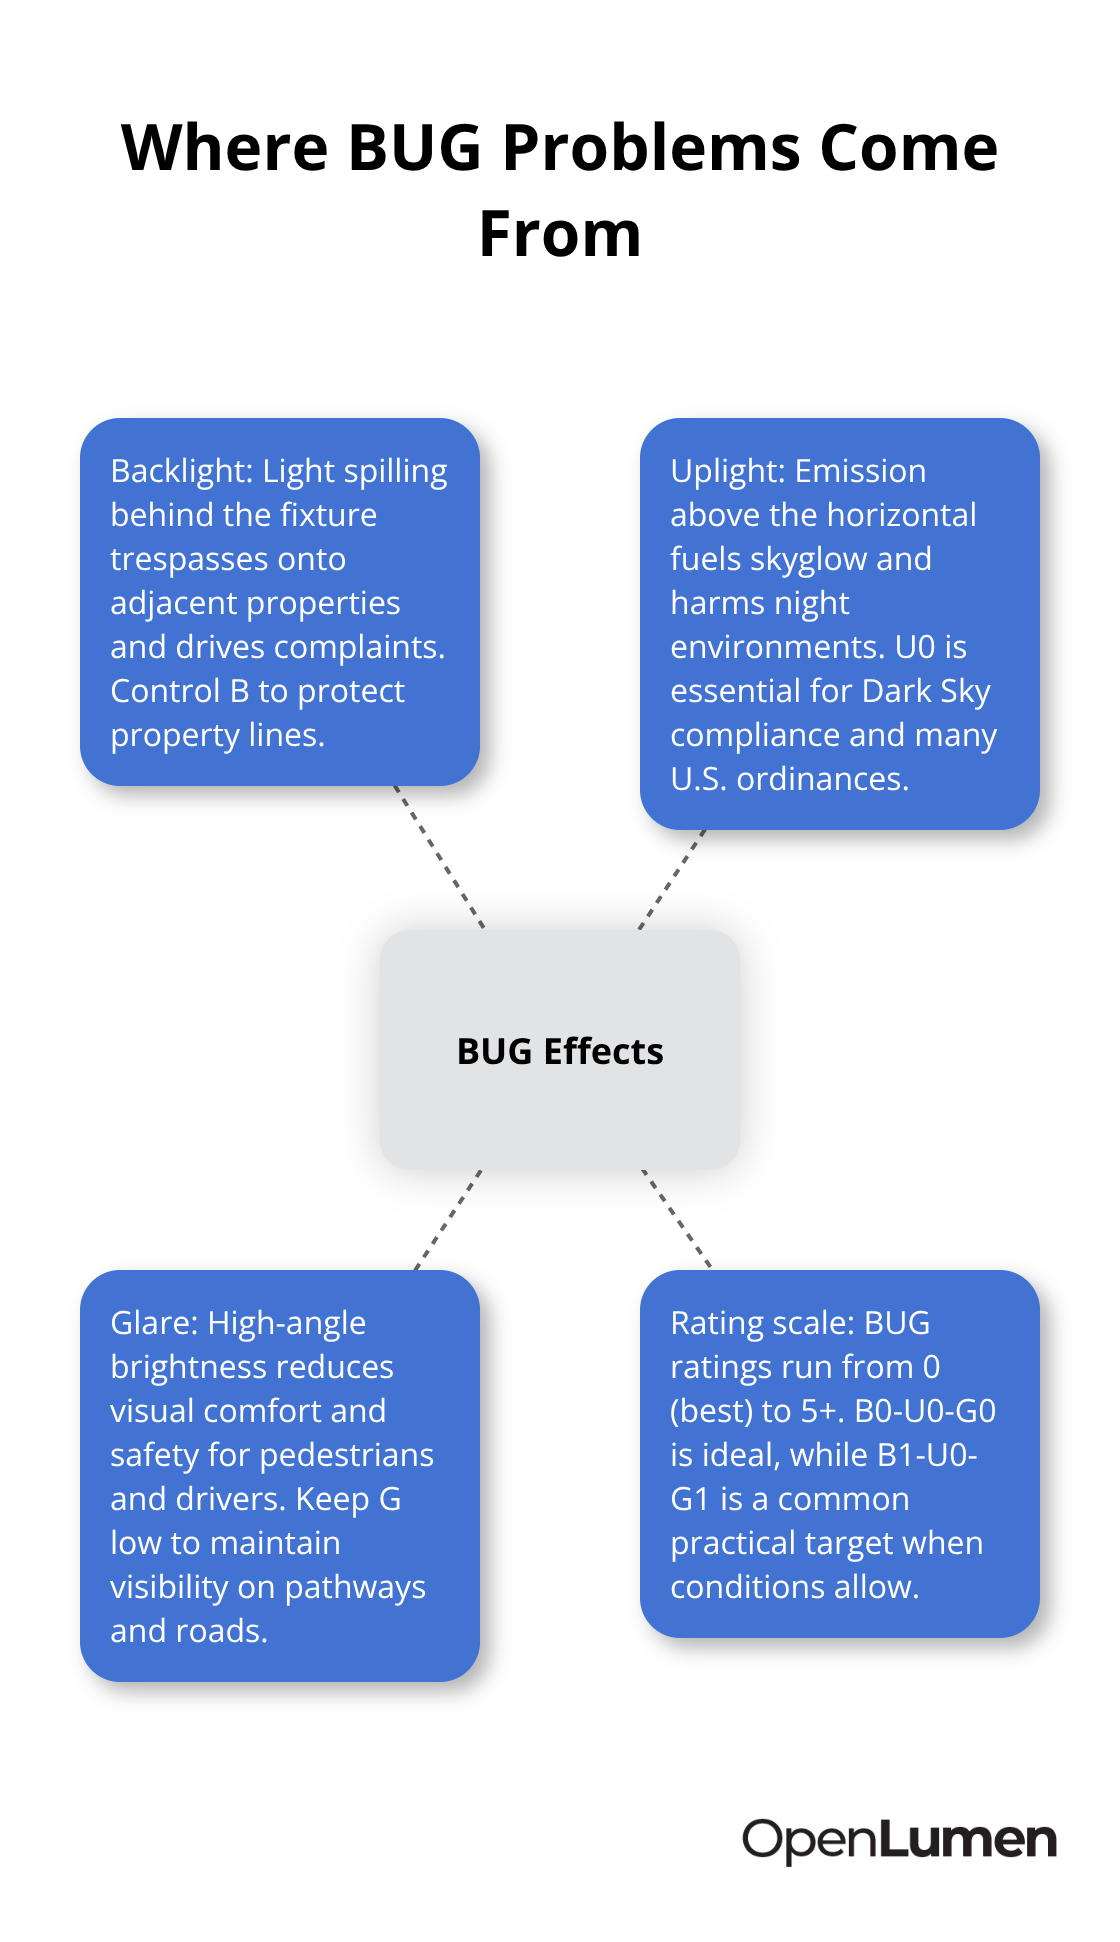
The ratings range from 0 (best) to 5 or higher, so B0-U0-G0 represents the ideal target, though practical projects often accept B1-U0-G1 or similar compromises based on site conditions.
Finding and Verifying BUG Data
Most manufacturers publish BUG data on their specification sheets alongside the IES photometric file, giving you the raw data to verify claims. If a vendor won’t provide both the BUG rating and the underlying IES file, that signals a problem-municipal codes typically require the IES file for submittals, and missing data suggests the manufacturer hasn’t invested in laboratory testing. Request both documents before you commit to a fixture; this step eliminates surprises during code review.
Matching BUG Targets to Your Installation Type
Wall packs mounted near property lines demand aggressive BUG targets because any backlight or uplight spills directly onto neighbors. Try B0-B1 and U0 to minimize trespass; if you see B3 or higher on a wall pack spec, reject it immediately because code violations and complaints will follow. Pole-mounted flood lights have more flexibility because distance increases, so a B2-U1-G0 rating often works for area lighting while still controlling uplight and glare.
Dark Sky compliance hinges entirely on uplight-U0 is non-negotiable if your project falls under International Dark-Sky Association guidelines or local ordinances that reference them. Many designers assume LED automatically means Dark Sky compliance, but that’s false; verify the uplight rating on the data sheet rather than guessing. Shielded or full-cutoff fixture designs achieve lower BUG ratings because they direct light downward and block high-angle output, so prioritize these designs when tight BUG targets are required.
How to Compare Fixtures Using BUG Data
A practical approach compares three fixtures side-by-side using their BUG ratings and photometric plots-you’ll immediately see how B2-U0-G1 distributes differently from B0-U1-G2, and that visual comparison teaches you more than any explanation. This method reveals which fixture actually meets your site constraints before you order anything. With this foundation in BUG ratings, you’re ready to tackle the next challenge: reading and interpreting the photometric charts that back up these numbers.
How to Read BUG Charts and Compare Fixtures Correctly
Understanding Polar Plots and What They Show
Photometric charts look intimidating at first, but they’re just visual maps showing where light actually goes. The polar plot-a circular chart with concentric rings-displays candela intensity in every direction from your fixture, with angle zones marked around the perimeter. The backlight zone occupies the area behind the fixture (roughly 90 to 270 degrees on the plot), the uplight zone sits above the horizontal (90 to 180 degrees), and the glare zone covers the high-angle regions where brightness matters most for visual comfort. To read a polar plot, find the direction you care about (say, toward a neighboring property), then trace from the fixture center outward along that angle until you hit the intensity curve. The distance from center to curve tells you candela output in that direction-closer to center means lower output, further out means higher.
Extracting Numbers from BUG Rating Tables
Most manufacturers publish a BUG rating table alongside the polar plot, listing exact B, U, and G values with their corresponding lumen totals per zone. This table translates the visual plot into concrete numbers you can compare across products without interpreting curves. A fixture showing B2-U0-G1 means moderate backlight output, zero uplight, and low glare-reading those three numbers tells you immediately whether it fits your site constraints.
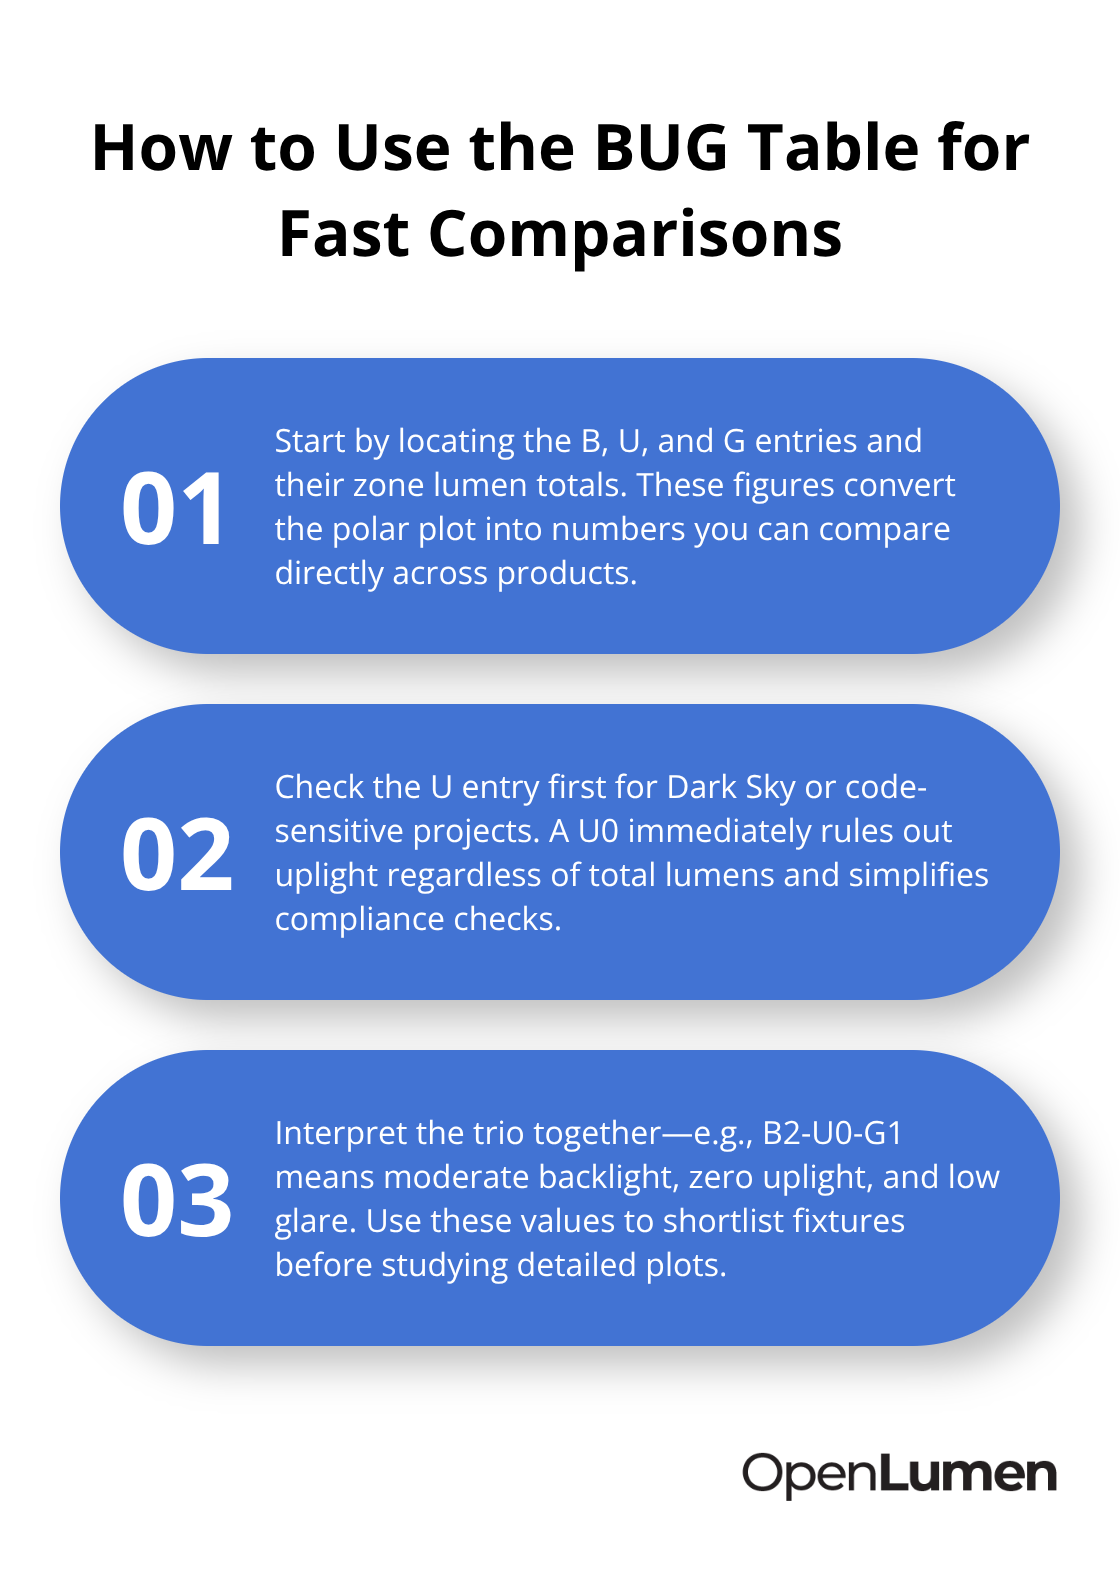
Don’t skip this table; it’s where the real comparison work happens.
Setting Up a Side-by-Side Fixture Comparison
Comparing fixtures requires side-by-side photometric data from the same test conditions, which is why demanding laboratory-tested IES files from manufacturers matters. Pull the specification sheets for three candidate fixtures and extract their BUG ratings and total lumen output per zone-spreadsheet this data so you see B-zone lumens, U-zone lumens, and G-zone lumens for each option. A wall pack with B1-U0-G1 at 500 total lumens behaves completely differently from one rated B3-U1-G2 at 600 lumens; the second fixture spills significantly more light backward and upward despite higher total output, making it unsuitable for tight property lines.
Matching BUG Targets to Installation Type
Municipal codes frequently require both the BUG rating and the underlying IES photometric file before approval, so always verify the vendor has both before you specify. When selecting fixtures for your actual project, match the BUG target to installation type first-wall packs near property lines get B0-B1 and U0, pole-mounted floods allow B1-B2 with U0, and Dark Sky projects demand U0 regardless of fixture type. Then cross-reference the photometric plot to confirm the rating matches reality; look for zero output in the uplight zone (the top half of the polar plot should show zero or near-zero candela) and minimal backlight curvature.
Verifying Claims Against Actual Data
If a vendor claims U0 but the polar plot shows visible intensity above 90 degrees, trust the plot and reject the fixture. This verification step catches mismatches between marketing claims and laboratory results-a common problem when manufacturers haven’t tested fixtures under rigorous conditions. With accurate BUG data and photometric plots in hand, you’re equipped to spot which fixtures actually control light pollution and which ones create problems. The next step is understanding how to apply these ratings to real-world site constraints and avoid the mistakes that derail projects during installation.
Where BUG Data Gets Ignored and Projects Suffer
The Cost of Skipping BUG Analysis Early
Most teams skip BUG analysis entirely during design because electrical drawings don’t demand it and initial specs feel complete without it. Then the contractor arrives on site, installs fixtures, and discovers backlight spilling onto a neighbor’s property or uplight visible from blocks away-forcing redesigns that blow timelines and budgets. The IES TM-15-11 standard exists precisely because light distribution matters, yet contractors still order fixtures based on wattage and total lumens alone, treating BUG ratings as optional fine-print. If your municipality requires code compliance before installation-and most do-you’ll face rejection and costly revisions if BUG targets weren’t locked in during the design phase.
Start BUG evaluation the moment you select candidate fixtures, not after purchase orders are placed. Compare three fixtures side-by-side using their actual BUG ratings and photometric plots before committing; this 30-minute exercise prevents weeks of delay later. Wall packs near property lines absolutely require B0-B1 and U0 verification against the polar plot before specification-no exceptions.
Red Flags in Vendor Documentation
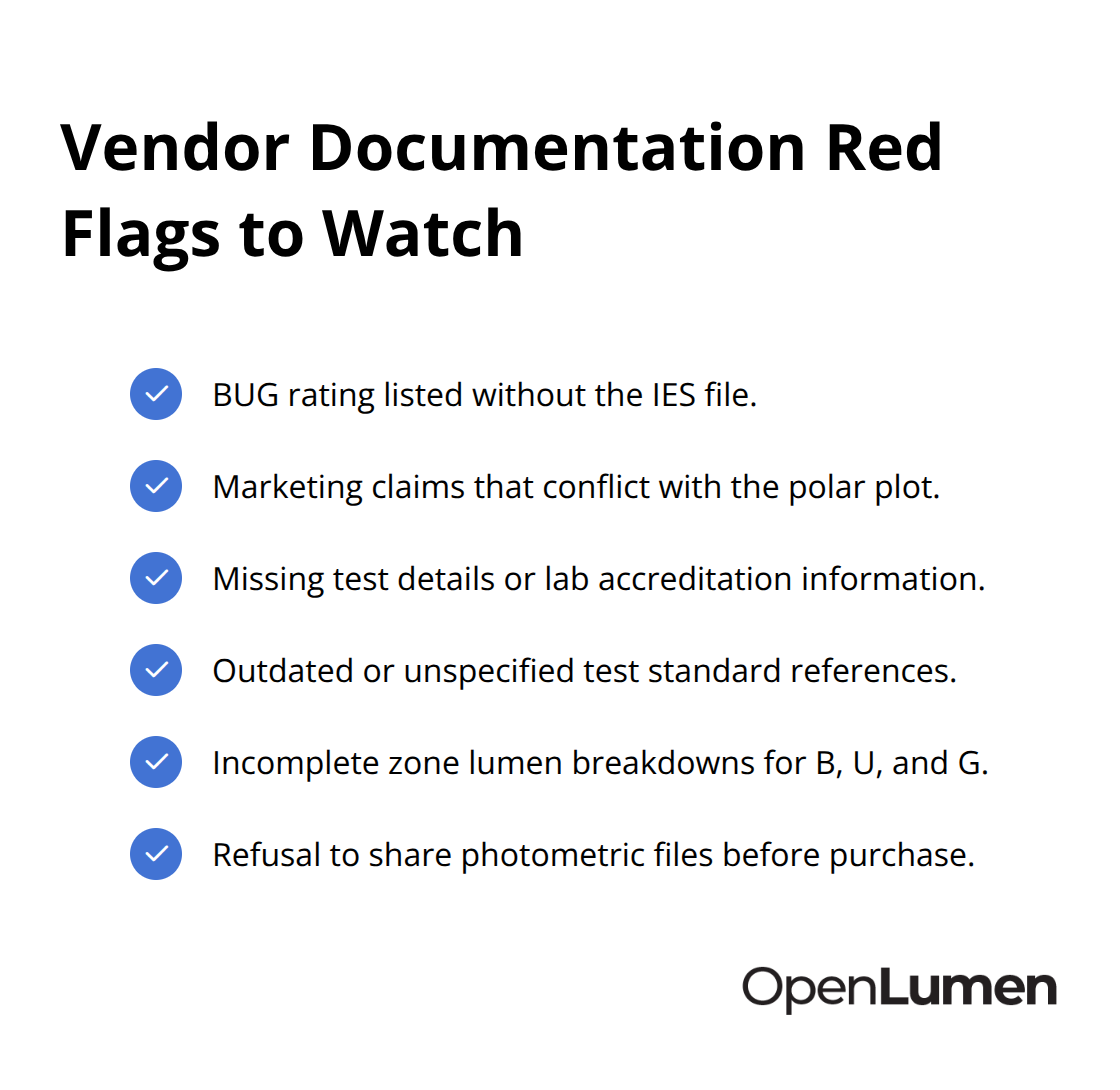
If a vendor’s spec sheet lists a BUG rating but no underlying IES file, that signals insufficient laboratory testing; demand both documents or move to another manufacturer. This requirement protects your project because municipal codes typically require the IES file for submittals, and missing data indicates the manufacturer hasn’t invested in rigorous testing. Vendors who provide complete photometric documentation demonstrate commitment to data quality and reduce your risk of specification failures.
Misreading Charts and Choosing Wrong Fixtures
Misreading photometric charts happens when designers focus on total lumen output and ignore directional intensity, assuming higher wattage automatically solves coverage problems. A fixture rated 600 lumens with B3-U1-G2 delivers far more problematic light distribution than one rated 500 lumens with B1-U0-G1, yet inexperienced teams choose the brighter option without checking the polar plot. The candela curve on that plot shows exactly where light goes; if the curve extends far into the backlight zone (the area behind the fixture on the chart), spillage onto neighboring properties is inevitable regardless of total output.
Overlaying multiple polar plots from competing fixtures reveals instantly which one concentrates light downward and which one wastes energy on unwanted directions. This visual comparison method teaches more than any specification sheet alone and prevents costly fixture selections that fail on site.
Regional Standards and Dark Sky Compliance
Regional light pollution ordinances-increasingly enforced by municipalities following International Dark-Sky Association guidelines-mandate U0 uplight ratings in many jurisdictions, yet teams still specify fixtures with U1 or U2 and face permit rejection. Check your local codes and any Dark Sky requirements before finalizing luminaire selections; this step takes minutes and prevents specification failures. If your project involves wildlife considerations or sits near astronomical observatories, uplight control becomes non-negotiable, and shielded or full-cutoff fixture designs are the only viable option.
Verify that your chosen fixtures align with these regional standards by confirming U0 on both the specification sheet and the polar plot-visual confirmation eliminates guesswork and protects your project from code violations.
Final Thoughts
BUG rating tips matter because they separate lighting designs that work from those that create problems on site. You’ve learned that BUG ratings predict light trespass, skyglow, and glare before installation happens, giving you the power to catch mistakes during the design phase instead of after contractors mount fixtures. Always demand both the BUG rating and the underlying IES photometric file from manufacturers, compare fixtures side-by-side using their actual polar plots rather than trusting total lumens alone, and match BUG targets to your specific installation type and regional codes before placing orders.
Better photometric understanding transforms how your team approaches lighting projects. Instead of discovering that a wall pack spills light onto a neighbor’s property after installation, you identify that problem in 30 minutes by reviewing the photometric data upfront. Instead of facing permit rejection because your fixtures don’t meet Dark Sky compliance, you verify U0 ratings before specification. Instead of wasting budget on high-output fixtures that distribute light in unwanted directions, you select lower-wattage options with superior BUG control that actually solve your coverage problem while reducing energy use.
Start every project by extracting BUG ratings and polar plots from three candidate fixtures, then compare them side-by-side against your site constraints. Verify that municipal codes and regional light pollution standards are met before finalizing selections. Use OpenLumen to access community-verified luminaires, photometric layouts, and real-time illuminance analysis so you validate designs without expensive software or steep learning curves.
The information provided is for general educational purposes only and should not be considered professional engineering or lighting design advice. Always verify project requirements, local codes, and specifications with qualified professionals before making final decisions.