Design proposals with photometry separate winners from the rest. Clients see hard numbers instead of guesses, and that builds real confidence in your designs.
At OpenLumen, we’ve watched contractors close deals faster when they back up their ideas with actual light data. Photometric analysis removes the back-and-forth that kills projects.
Why Numbers Win Over Guesses
Footcandles Speak Louder Than Promises
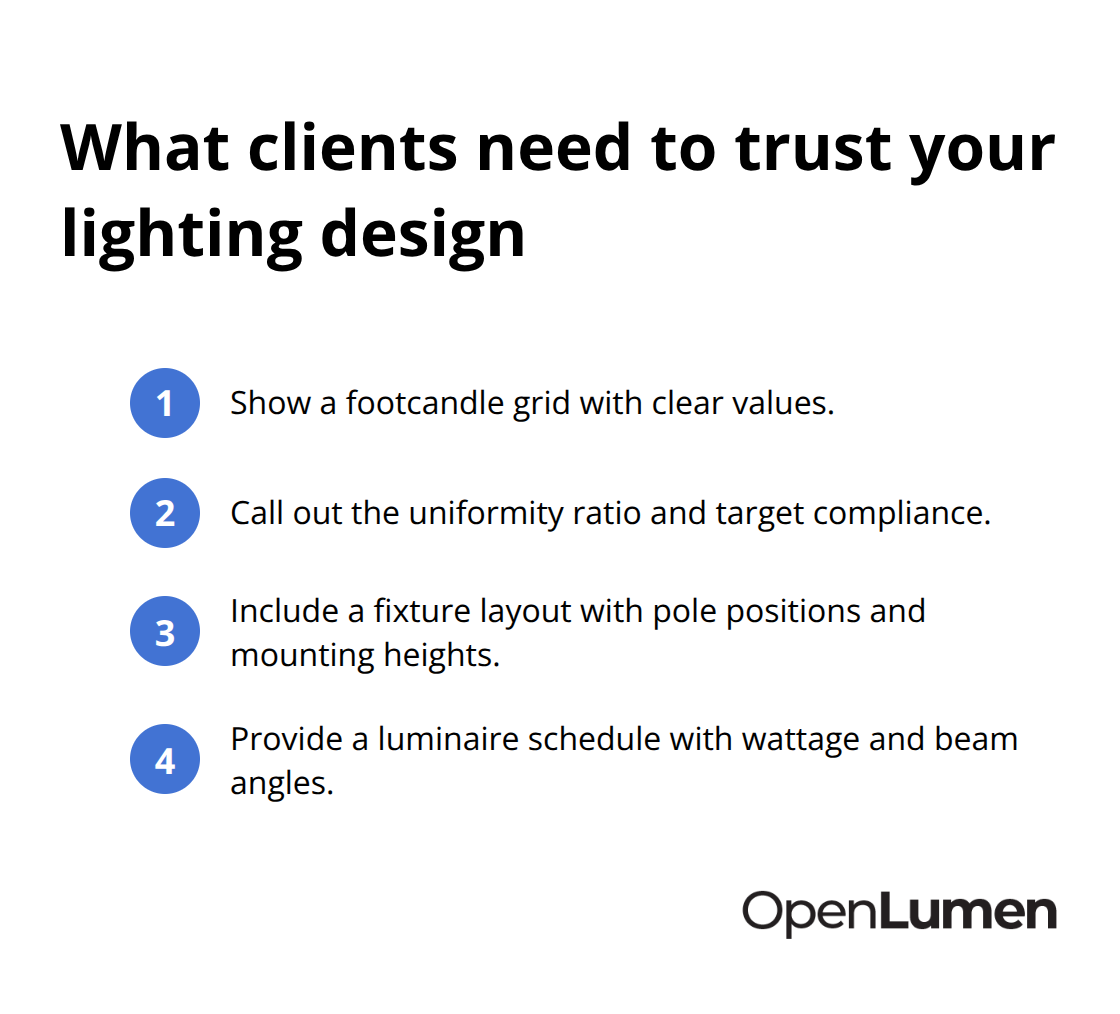
Clients stop asking questions when they see actual footcandle data on a site plan. A parking lot owner doesn’t want to hear that a design will be bright enough-they want to see 2.5 footcandles average across the asphalt with a 3.2:1 uniformity ratio. That specificity kills doubt. When you present a photometric report with a footcandle grid, fixture layout, and a luminaire schedule showing exact wattages and beam angles, the conversation shifts from whether your design works to when they can install it. Contractors move from proposal rejection to contract signature in days instead of months when they stop guessing and start showing real numbers. The data removes the emotional negotiation that happens when a client imagines the space might be too dark or too bright.
Compliance Happens Faster With Documentation
Photometric studies compress approval timelines because permit offices and facility managers verify compliance instantly. A municipality requiring IES standards or dark sky compliance won’t accept vague promises-they need documented proof that your design meets code. A photometric report provides that proof in one file. Sports facilities governed by NCAA lighting rules or IES standards demand the same certainty; without a photometric analysis, you’re asking them to trust your experience rather than showing them data that matches their rulebook. The uniformity ratios, footcandle grids, and isoline plots in a professional report answer every technical question before it’s asked.
Visual Proof Removes Risk
Property owners move faster when they see 3D renderings or heat maps showing exactly how light falls across their space. That visual confirmation, paired with the numbers, removes the risk they perceive in approving your design. Retrofits from HID to LED benefit most from this approach-clients worry new fixtures won’t deliver the same light, so a photometric study proving equal or better illumination closes that objection before the budget conversation even starts. Real data prevents the revision cycles and scope creep that waste weeks of your time.
Where Photometric Data Fits Into Your Workflow
Hard numbers eliminate friction in the sales process. When you back proposals with actual light analysis (footcandle grids, uniformity ratios, and fixture schedules), clients see proof instead of promises. This foundation matters because the next step-actually building those proposals-requires the right tools and approach to turn raw photometric data into persuasive client documents.
How to Turn Photometric Data Into Winning Proposals
Calculate Illuminance Levels From Your Site
Start with the right calculation method instead of guessing at fixture counts and mounting heights. Use software that calculates illuminance levels directly from your site geometry and fixture selection. Input your space dimensions, pole or ceiling heights, fixture model, beam angle, and aiming angle-the software runs millions of ray-trace calculations and outputs footcandle values at thousands of points across your area. This matters because a parking lot owner needs to see that their 200 by 150 foot lot will receive 2.8 footcandles average with a 3.1:1 uniformity ratio, not a generic promise of adequate lighting.
The footcandle grid in your report shows exact values in a color-coded plan view; darker areas reveal dark spots you can fix before presenting. Uniformity ratios tell the story clients care about: a 4:1 ratio means the brightest point is four times brighter than the dimmest, which works for most commercial spaces but fails for sports facilities requiring 3:1 or tighter. When you present these numbers alongside your fixture layout showing exact pole positions and mounting heights, clients see a design they can trust because the math is visible and verifiable.
Build Reports That Answer Every Question
Professional reports do more than show footcandles. A complete photometric analysis includes polar charts showing how each fixture distributes light in all directions, BUG ratings (Backlight, Uplight, Glare) that demonstrate dark sky compliance, and a luminaire schedule listing every fixture’s catalog number, wattage, lumen output, beam angle, and color temperature. This combination lets you compare multiple design options instantly: run one layout with 400W fixtures at 30 feet spacing, then run another with 250W fixtures at 20 feet spacing, and show the client side-by-side footcandle grids, uniformity data, and total wattage for each option.
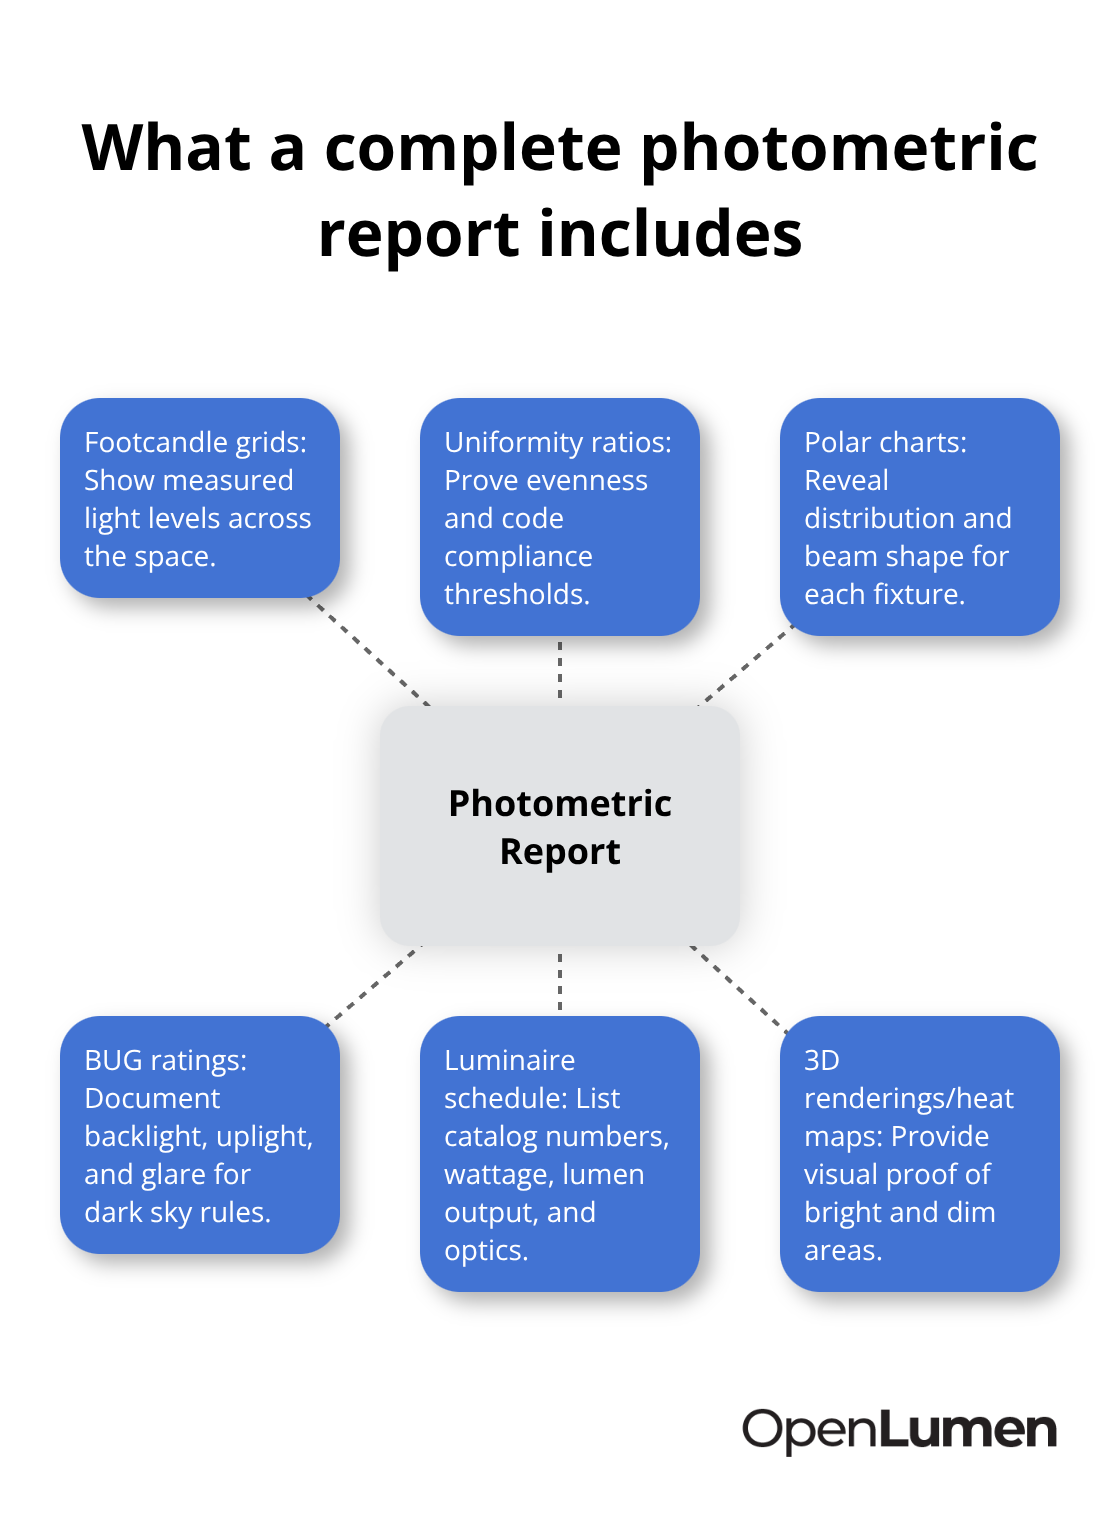
The client sees not just light levels but also operating cost differences and compliance proof in one document. When you retrofit an existing HID system to LED, this comparison becomes your strongest sales tool because it proves new fixtures deliver equal or better performance despite different beam patterns. Include 3D renderings or heat maps in your report and the visual impact reinforces the numbers-clients see warm colors where light is bright and cool colors where it’s dim, making the design instantly understandable without technical training.
Move From Defense to Confidence
This approach compresses your sales cycle because you stop defending design choices in follow-up emails. Instead, you present complete, verified analysis that answers every question upfront. The client moves from skepticism to approval faster when they hold a professional report with footcandle grids, uniformity data, fixture schedules, and visual proof all in one file. That confidence shift happens because the numbers eliminate the emotional negotiation that stalls projects.
The next step involves recognizing which mistakes derail even solid photometric work-oversights that waste your data advantage and cost you sales.
Common Photometric Mistakes That Cost Sales
Uniformity Requirements Determine Success or Failure
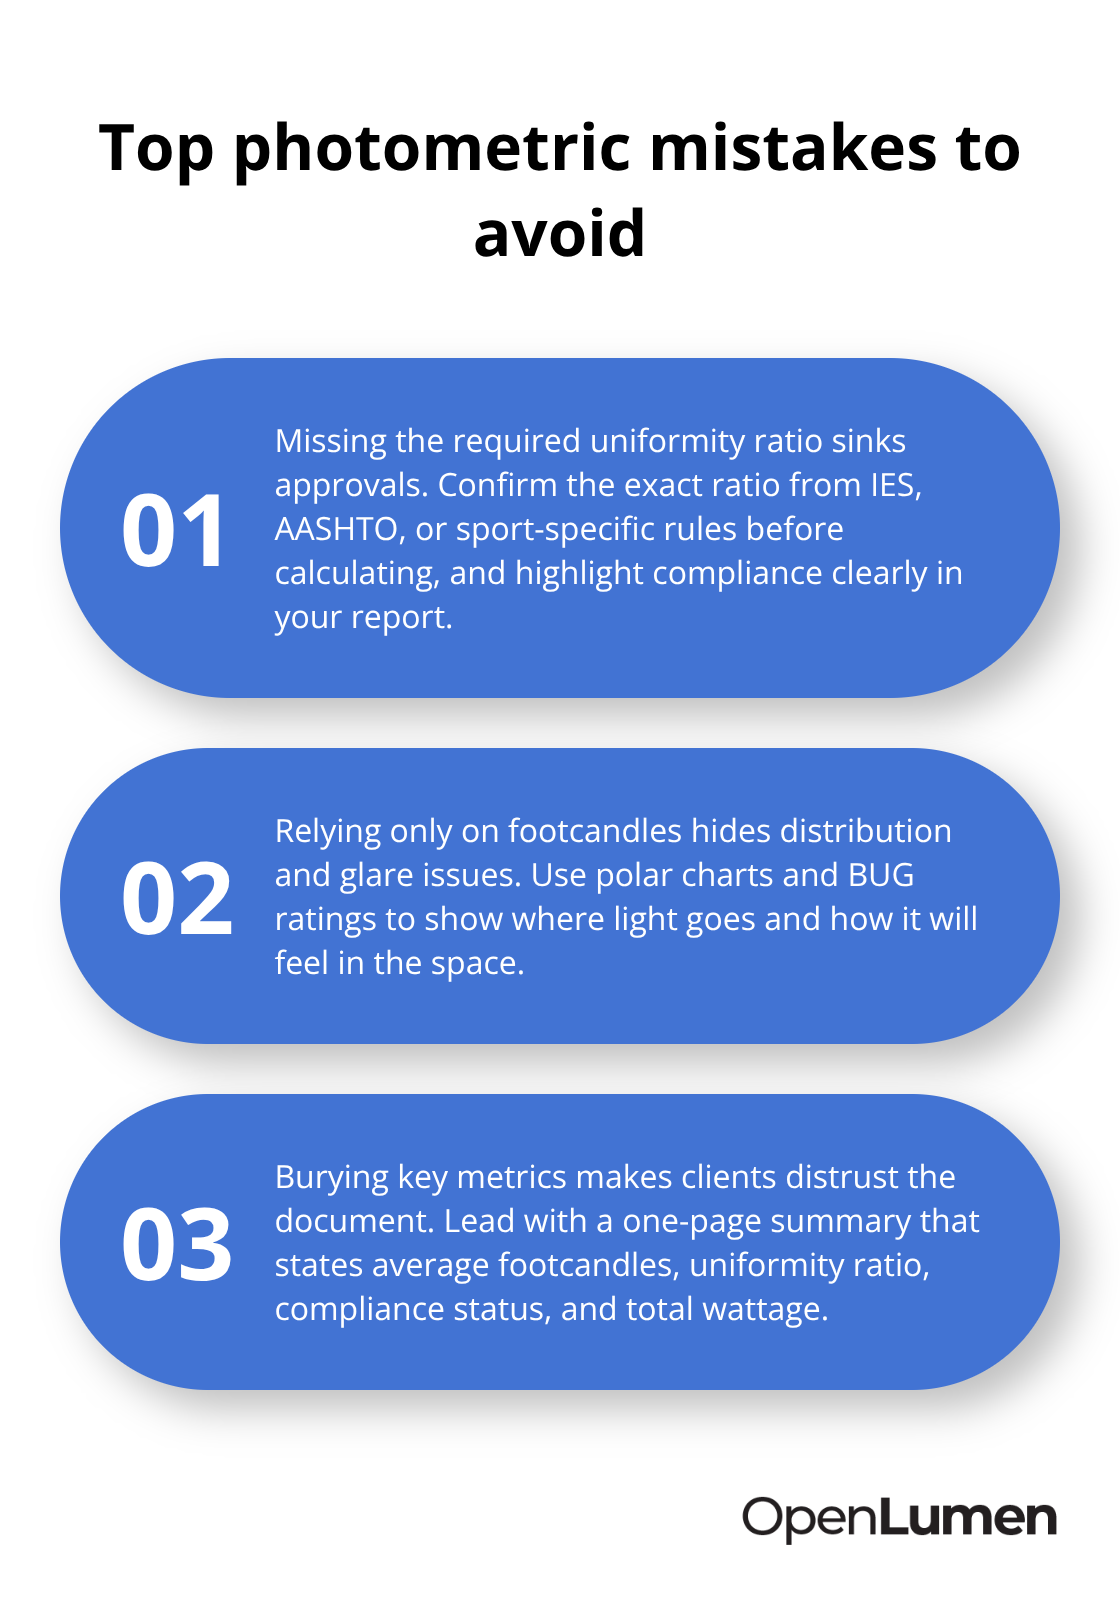
Solid photometric analysis means nothing if you ignore uniformity requirements that your client’s governing body demands. A parking lot design showing 3.2 footcandles average across the surface looks impressive until the municipality rejects it because the uniformity ratio hits 5.2:1 when code requires 4:1 or better. You wasted time on a report that doesn’t solve the actual problem. The same trap catches sports lighting designers constantly: a baseball field lit to 50 footcandles average sounds adequate until you present it to the facility manager and learn that NCAA rules require 3:1 uniformity or tighter for televised games. Your design fails compliance, and the client assumes your analysis was wrong instead of recognizing that you designed to the wrong target.
Before you run any photometric calculation, confirm the exact uniformity ratio your client needs. IES standards, AASHTO guidelines, and sport-specific rules all specify these ratios. A parking lot owner might accept 4:1 uniformity, but a warehouse floor where forklifts operate needs tighter distribution. When you present a photometric report without calling out the uniformity ratio prominently and confirming it meets code, you hand the client a document they cannot use. Your credibility takes the hit, not the software.
Polar Charts Reveal Distribution Problems That Footcandles Hide
Glare and light distribution problems kill proposals because contractors present footcandle numbers without addressing where light actually goes and what it hits. A 5-foot-tall warehouse worker sees glare from an overhead fixture aimed at 45 degrees differently than the software models it at calculation points on the floor. BUG ratings tell part of the story-backlight, uplight, and glare classifications show dark sky compliance-but they don’t tell the client how the space will actually feel.
Polar charts display how light spreads in all directions from the source, so you can see if beam width is too wide or too narrow for your mounting height. Narrow beam angles create hot spots and dark zones; wide beams wash out uniformity. Present both the footcandle grid and the polar chart together, and the client understands not just brightness but distribution quality. When you retrofit HID to LED, this matters enormously because LED fixtures have directional optics that concentrate light differently than old HID floods. A 1:1 wattage swap without checking polar charts and beam angles leaves the space under-lit in the corners or creates glare in unexpected places.
Include 3D renderings or heat maps in your report so the client sees exactly where light lands and where shadows remain. That visual context prevents the approval delays that happen when a client approves a report only to find the installed system doesn’t match their mental picture.
Structure Reports to Lead With Answers, Not Data Tables
Data without context becomes a liability instead of a sales tool. A 15-page photometric report full of footcandle grids, uniformity tables, and isoline plots overwhelms most clients and obscures your strongest arguments. Present the key metrics upfront: average footcandles, uniformity ratio, compliance status, and fixture count with total wattage. Highlight which metrics matter most for that specific project.
A parking lot owner cares about average footcandles and dark sky compliance; a sports facility cares about uniformity and evenness across the playing surface. When you bury compliance proof on page 8 and the client sees only a confusing grid on page 1, they don’t trust the document. Structure your report to lead with the answer, not the data. Show a one-page summary with the footcandle average, uniformity ratio, and a statement like “This design meets IES standards with a 3.8:1 uniformity ratio and complies with municipal dark sky limits.” Then provide supporting details and visuals.
A color-coded heat map showing brightness levels across the space communicates faster than a raw footcandle table. Contractors who win projects consistently present a clean visual first, then back it up with the numbers. Skip the context, and even accurate data looks suspicious to clients who cannot interpret it.
Final Thoughts
Photometric data transforms how contractors and designers win projects. When you present footcandle grids, uniformity ratios, and fixture schedules instead of promises, clients move from skepticism to approval. The numbers eliminate the back-and-forth that kills timelines and wastes your sales effort on revisions that should never have happened.
Design proposals with photometry because it removes risk from the client’s decision. A parking lot owner sees exact illuminance levels instead of vague assurances. A facility manager verifies compliance with code before signing a contract. A sports facility director confirms uniformity meets NCAA standards without doubt.
The contractors winning the most projects right now present complete photometric analysis upfront-footcandle grids, polar charts, BUG ratings, and luminaire schedules in one professional report. They compare multiple design options side by side so clients see cost and performance trade-offs instantly. They structure reports to lead with answers, not data tables, which compresses approval cycles from months to weeks because every technical question gets answered before it’s asked. OpenLumen is a free, browser-based platform that lets you create photometric layouts, run real-time illuminance analysis, and generate professional reports without the complexity of traditional tools.
The information provided is for general educational purposes only and should not be considered professional engineering or lighting design advice. Always verify project requirements, local codes, and specifications with qualified professionals before making final decisions.