Most lighting professionals grab total lumens data and call it a day. That’s a mistake that leads to poorly lit spaces and wasted energy.
Zonal lumens tell you where light actually goes. At OpenLumen, we’ve seen countless projects fail because teams ignored directional output and relied only on total lumen counts. This zonal lumens overview explains what the data means and how to use it correctly.
What Zonal Lumens Actually Tell You
Zonal lumens measure how much light a fixture sends into specific angular zones around itself, typically broken into ten-degree segments. Instead of reporting only total light output, zonal lumens show you the distribution pattern-how much light travels downward between 0 and 30 degrees, how much goes between 30 and 60 degrees, and so on all the way up to 180 degrees. The IES Indoor Report standard divides this into downlight (0–90 degrees), uplight (90–180 degrees), and overall output. This matters because a fixture rated 3,000 lumens tells you nothing about where those lumens actually land in your space. Two fixtures with identical total lumen counts can throw light completely differently. One might send 70 percent of its output downward for task lighting, while another spreads lumens evenly in all directions, creating spill light and glare you never wanted.
The Critical Difference from Total Lumens
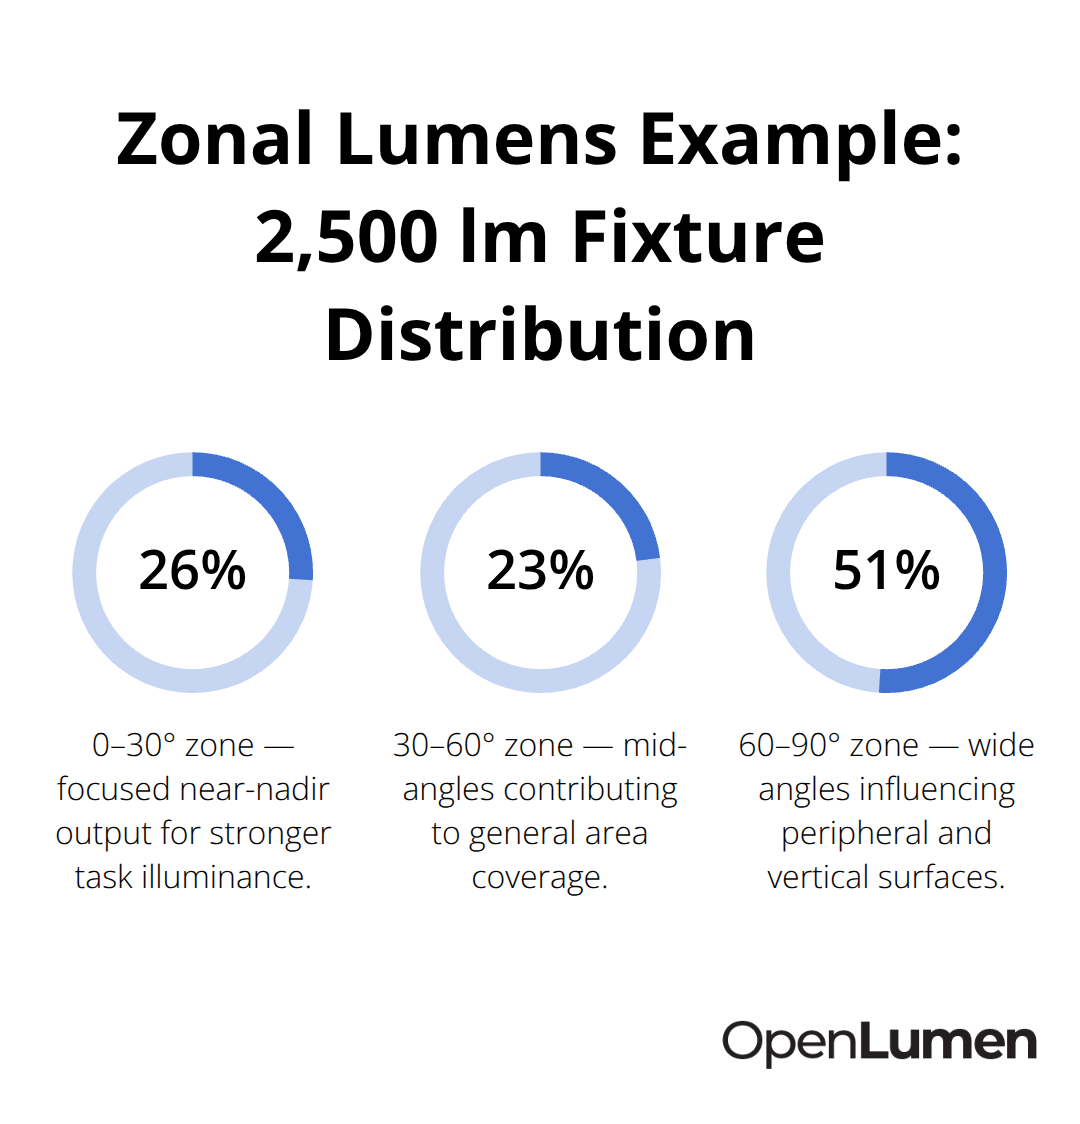
Total lumens is a single number. Zonal lumens break that number into directional pieces. Think of it this way: a fixture with 2,500 total lumens might have 650 lumens in the 0–30 degree zone (26 percent of total), 580 lumens in the 30–60 degree zone (23 percent), and 1,270 lumens in the 60–90 degree zone (51 percent). That distribution pattern is what zonal data reveals.
You cannot figure this out from total lumens alone. When you compare two fixtures in a photometric report, the zonal lumen summary shows exactly where each one concentrates its light. This is why contractors and designers rely on zonal data to predict real-world performance before installation. A warehouse aisle needs lumens concentrated downward; a wall-wash application needs lumens directed upward and outward. Total lumens cannot tell you which fixture does which job better.
Why Manufacturers Must Report This Data
Manufacturers report zonal lumens because lighting standards require it and because lighting professionals demand transparency. The IES LM-79-19 standard mandates that photometric reports include candela distribution data and zonal lumen summaries. This gives designers the factual breakdown they need to calculate illuminance on work planes, control glare, and avoid over-lighting or under-lighting spaces. Without zonal data, you are left to guess. You cannot verify whether a fixture will deliver adequate light to a desk, whether it will create annoying brightness at eye level, or whether it wastes lumens on surfaces that do not need them. Photometric reports include this information because the alternative is expensive trial and error on job sites.
How Zonal Data Shapes Real Design Decisions
The zonal lumen breakdown transforms how you select and place fixtures. Instead of assuming all 3,000-lumen fixtures perform the same way, you can compare their actual light patterns and pick the one that matches your space. A fixture that concentrates 60 percent of its lumens in the 0–30 degree zone excels at task lighting on desks and work surfaces. A fixture that spreads lumens more evenly across 0–90 degrees works better for general ambient lighting in open areas. The photometric report shows you these percentages instantly, so you make informed choices rather than relying on marketing claims or past experience with similar-sounding products. This precision prevents costly mistakes and ensures your lighting design actually works when crews install it.
How to Use Zonal Lumens in Real Design Work
Match Zonal Distribution to Your Space Requirements
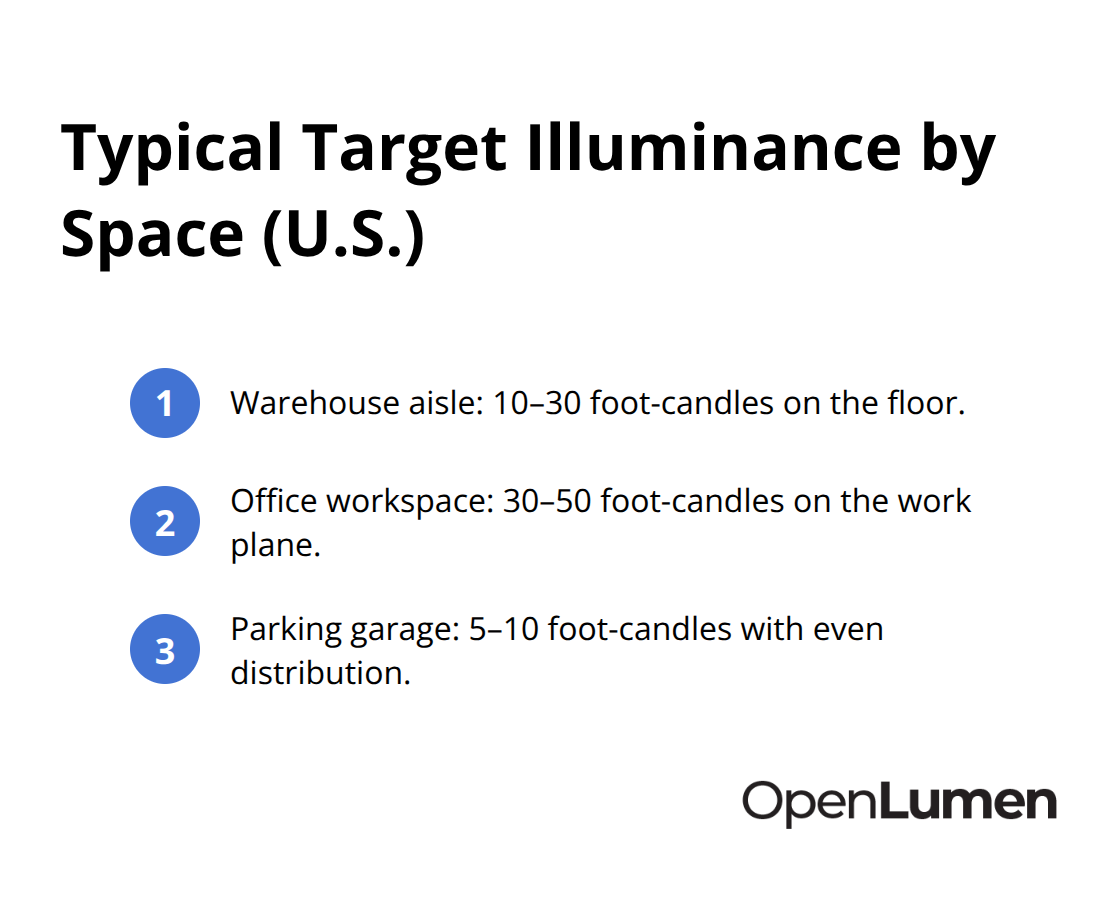
Zonal lumens data only matters when you apply it to specific spaces and tasks. Start with your space requirements. A warehouse aisle needs 10–30 foot-candles according to IES guidelines, concentrated on the floor. An office workspace needs 30–50 foot-candles on the work plane. A parking garage requires 5–10 foot-candles with even distribution to prevent dark spots.
Once you know your target illuminance, look at the zonal lumen breakdown in the photometric report. A fixture sending 60 percent of its lumens into the 0–30 degree zone will concentrate light directly below it, perfect for task lighting but risky for glare if mounted too low. A fixture distributing 40 percent downward and 35 percent sideways works better for general ambient lighting where you need coverage across a wider area. The key is matching the zonal distribution pattern to your space geometry and mounting height. At 10 feet high, a narrow downward pattern delivers concentrated illuminance. At 14 feet high, that same pattern spreads out more, so you might need a wider distribution to hit your target uniformity.
Compare Fixtures Through Zonal Data, Not Just Total Lumens
Comparing two fixtures without zonal data is guesswork. Fixture A might be rated 2,800 lumens with 58 percent output in the 0–60 degree zone. Fixture B might be 2,800 lumens with only 42 percent in that zone, sending more lumens sideways and upward. On paper they look identical. In your space, Fixture A delivers better task illuminance and lower glare risk. Fixture B creates more spill light and shadows. The photometric report shows you these differences instantly through the zonal lumen summary and candela distribution curve. Use this data to calculate actual foot-candles on your work plane before purchasing anything. Design software like AGi32, DIALux, and Relux imports the IES photometric file and runs illuminance grids showing you minimum, maximum, and average light levels across your space. This prevents the common mistake of confusing average foot-candles with minimum foot-candles-a space might average 40 foot-candles but have dark zones at only 15 foot-candles, creating uncomfortable shadows and reducing safety.
Identify Wasted Light and Energy Inefficiency
Zonal lumens also reveal whether a fixture wastes light where you do not need it. If your warehouse aisle is 12 feet wide and fixtures are mounted 16 feet high, lumens scattered into the 90–180 degree uplight zone are wasted energy bouncing off the ceiling or escaping outdoors. A fixture with minimal uplight output and concentrated downlight saves money and meets lighting codes more efficiently. This is why LEED projects and energy-conscious facilities managers demand zonal data-it proves whether a lighting design actually delivers what it promises without over-lighting or creating glare. Most teams fail at this stage because they pick a fixture based on total lumens, ignore the zonal breakdown, and end up with dark corners or glare problems that require expensive retrofits.
Understanding how zonal lumens perform in your specific space sets the foundation for avoiding costly mistakes. The next step is recognizing the common errors that teams make when they misinterpret or misapply this data.
Common Mistakes When Interpreting Zonal Lumens
Confusing Total Lumens with Zonal Distribution
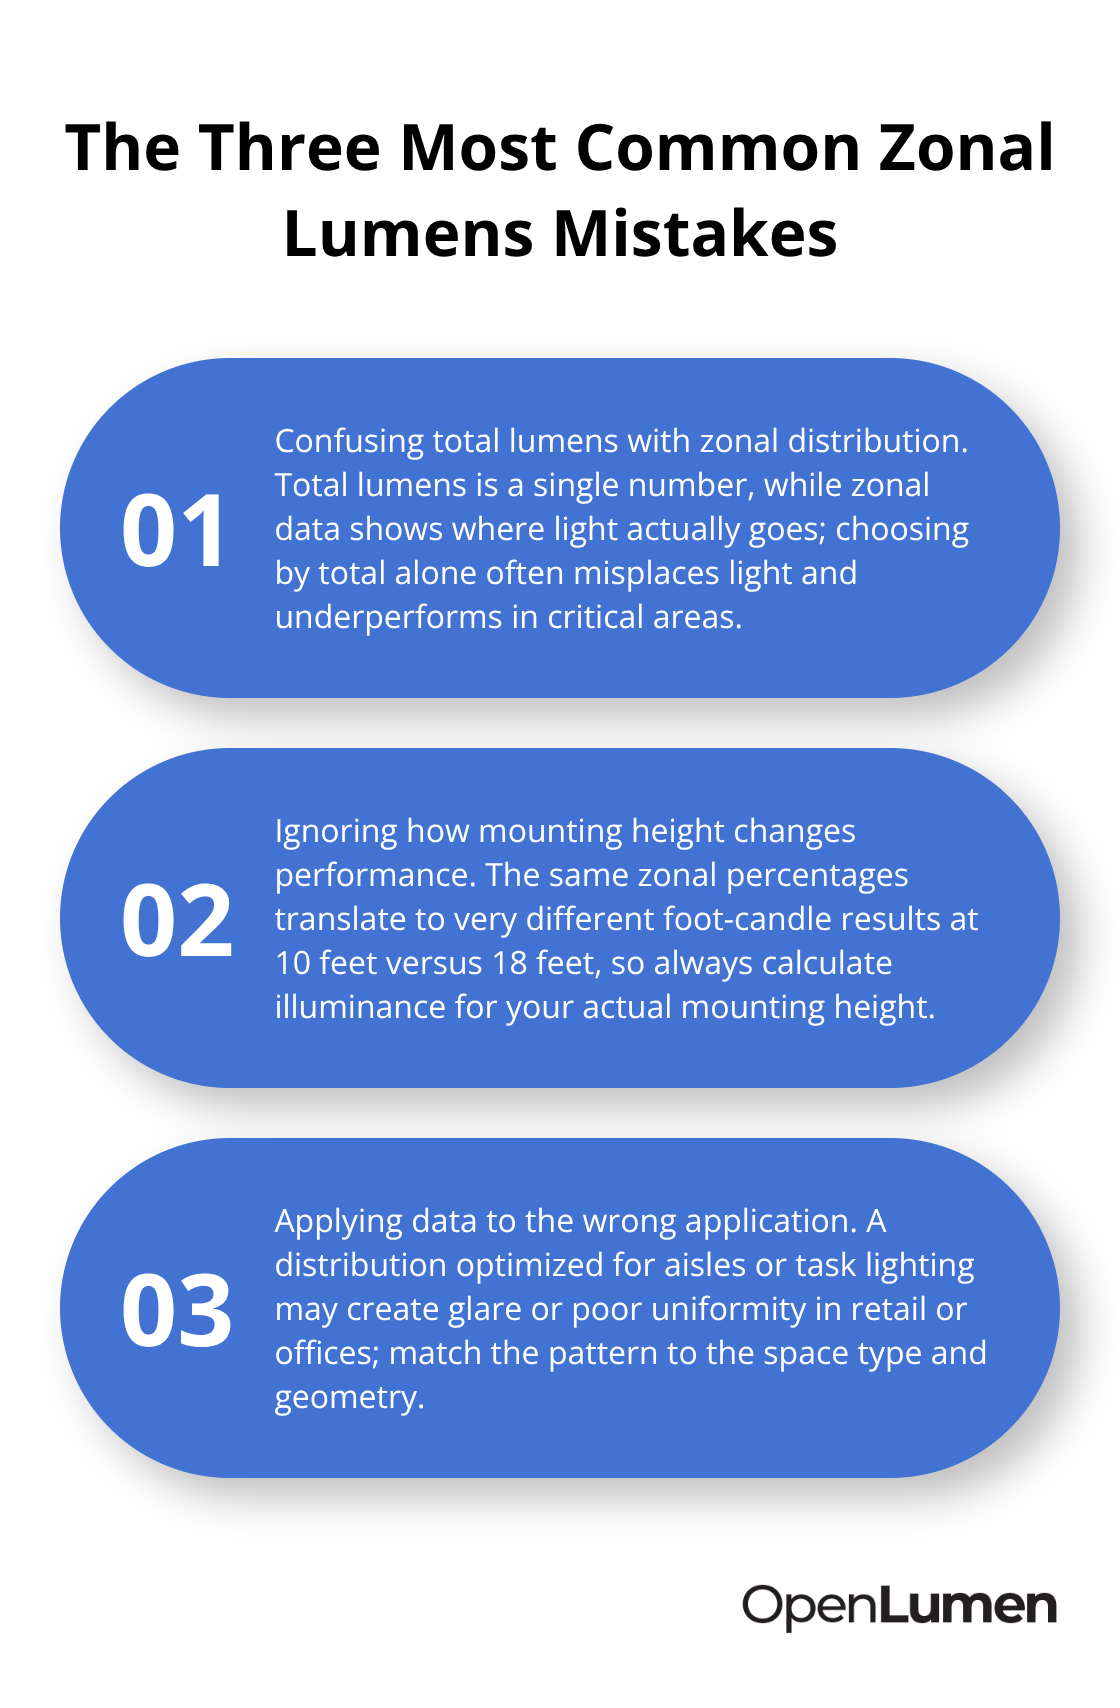
Teams treat total lumens as a substitute for zonal breakdown, and this error undermines lighting designs. A 3,000-lumen fixture tells you nothing about performance until you see how those lumens distribute across zones. One fixture might push 1,800 lumens downward (0–90 degrees) while another sends only 1,200 lumens down and wastes 1,800 into uplight zones where they create glare or bounce uselessly off ceilings. Both are rated 3,000 lumens. Both will fail your project if you pick based on that single number alone. The photometric report shows the zonal split instantly, but most teams skip this step and order fixtures based on marketing specs or price. This is why spaces feel dim in critical areas even though you installed enough total lumens to light them properly. The lumens landed in the wrong zones.
Ignoring How Mounting Height Affects Zonal Performance
Fixture distribution patterns change dramatically with mounting height and room geometry. A fixture with 50 percent of its lumens in the 0–30 degree zone performs differently at 10 feet than at 18 feet. At 10 feet, that concentrated downward beam creates bright spots and dark zones, requiring careful spacing to hit your uniformity target. At 18 feet, that same beam spreads out enough to cover more area, but now you might not hit your minimum foot-candles on the work plane without adding more fixtures. The zonal data itself does not change, but how it translates to real-world illuminance absolutely does. Teams compare fixtures using zonal percentages without calculating actual foot-candles in their specific space at their specific mounting height, then wonder why the layout does not match expectations when installed. Design software that imports IES photometric files prevents this mistake by showing you foot-candle grids before you purchase anything, but you must actually run those calculations.
Applying Zonal Data to the Wrong Application
Zonal data meant for one application fails in a completely different space type. A fixture optimized for warehouse task lighting with 65 percent downlight output is wrong for a retail showroom where you need balanced ambient light and wall illumination. The zonal lumens are excellent for their intended purpose and terrible for yours. Too many teams grab a photometric report, see decent numbers, and assume the fixture works everywhere. Zonal data is application-specific. An office ceiling fixture needs different distribution than a parking lot fixture, which needs different distribution than an accent light for artwork. Matching zonal output to your actual space type and mounting conditions is non-negotiable. Without that alignment, even perfect zonal data leads to poor results.
Conclusion
Zonal lumens data transforms lighting from guesswork into precision. When you understand how light distributes across angular zones, you stop wasting energy on spill light and start delivering exactly what your space needs. The difference between a well-lit, efficient installation and a costly failure often comes down to whether your team consulted zonal lumen data before ordering fixtures.
Start with your target illuminance-whether that is 10 foot-candles for a warehouse aisle or 50 foot-candles for an office desk-then pull the photometric report and compare how different fixtures concentrate their lumens in the zones that matter for your application. A fixture sending 60 percent of output downward excels at task lighting, while one spreading lumens more evenly works better for general ambient coverage. This zonal lumens overview reveals the real performance difference that total lumens alone cannot show.
Import the IES photometric file into design software and run an illuminance grid at your actual mounting height and space dimensions to prevent the three most common mistakes: confusing total lumens with zonal distribution, ignoring how mounting height changes performance, and applying data meant for one application to a completely different space. Calculate minimum and maximum foot-candles, not just averages, so you catch dark spots before installation.
OpenLumen streamlines this workflow by letting you access photometric data, run real-time illuminance analysis, and generate professional reports without expensive software, so data-driven design eliminates surprises and delivers lighting that actually works.
The information provided is for general educational purposes only and should not be considered professional engineering or lighting design advice. Always verify project requirements, local codes, and specifications with qualified professionals before making final decisions.