Most lighting projects fail because fixtures are placed without understanding how light actually spreads across a space. Uneven illumination wastes energy, creates dark spots, and frustrates users-all problems that proper lumen distribution planning prevents.
At OpenLumen, we’ve seen how photometric layouts transform design decisions from guesswork into precision. This guide shows you how to visualize light distribution, avoid costly mistakes, and optimize every fixture placement with real data.
Why Uneven Light Distribution Wastes Money and Creates Problems
Uneven light distribution ranks among the fastest ways to waste money on a lighting project. When fixtures are placed without analyzing how light actually spreads, hot spots emerge in some areas while dim zones appear in others. A warehouse with poor uniformity might deliver 50 foot-candles under one fixture and only 10 foot-candles a few feet away. That inconsistency forces you to over-light the entire space just to meet minimum levels in the darkest spots, burning energy and money continuously. Commercial lighting projects without proper distribution analysis typically consume 20–30% more energy than necessary. The real cost isn’t just wasted kilowatt-hours-it’s the operational expense that compounds month after month.
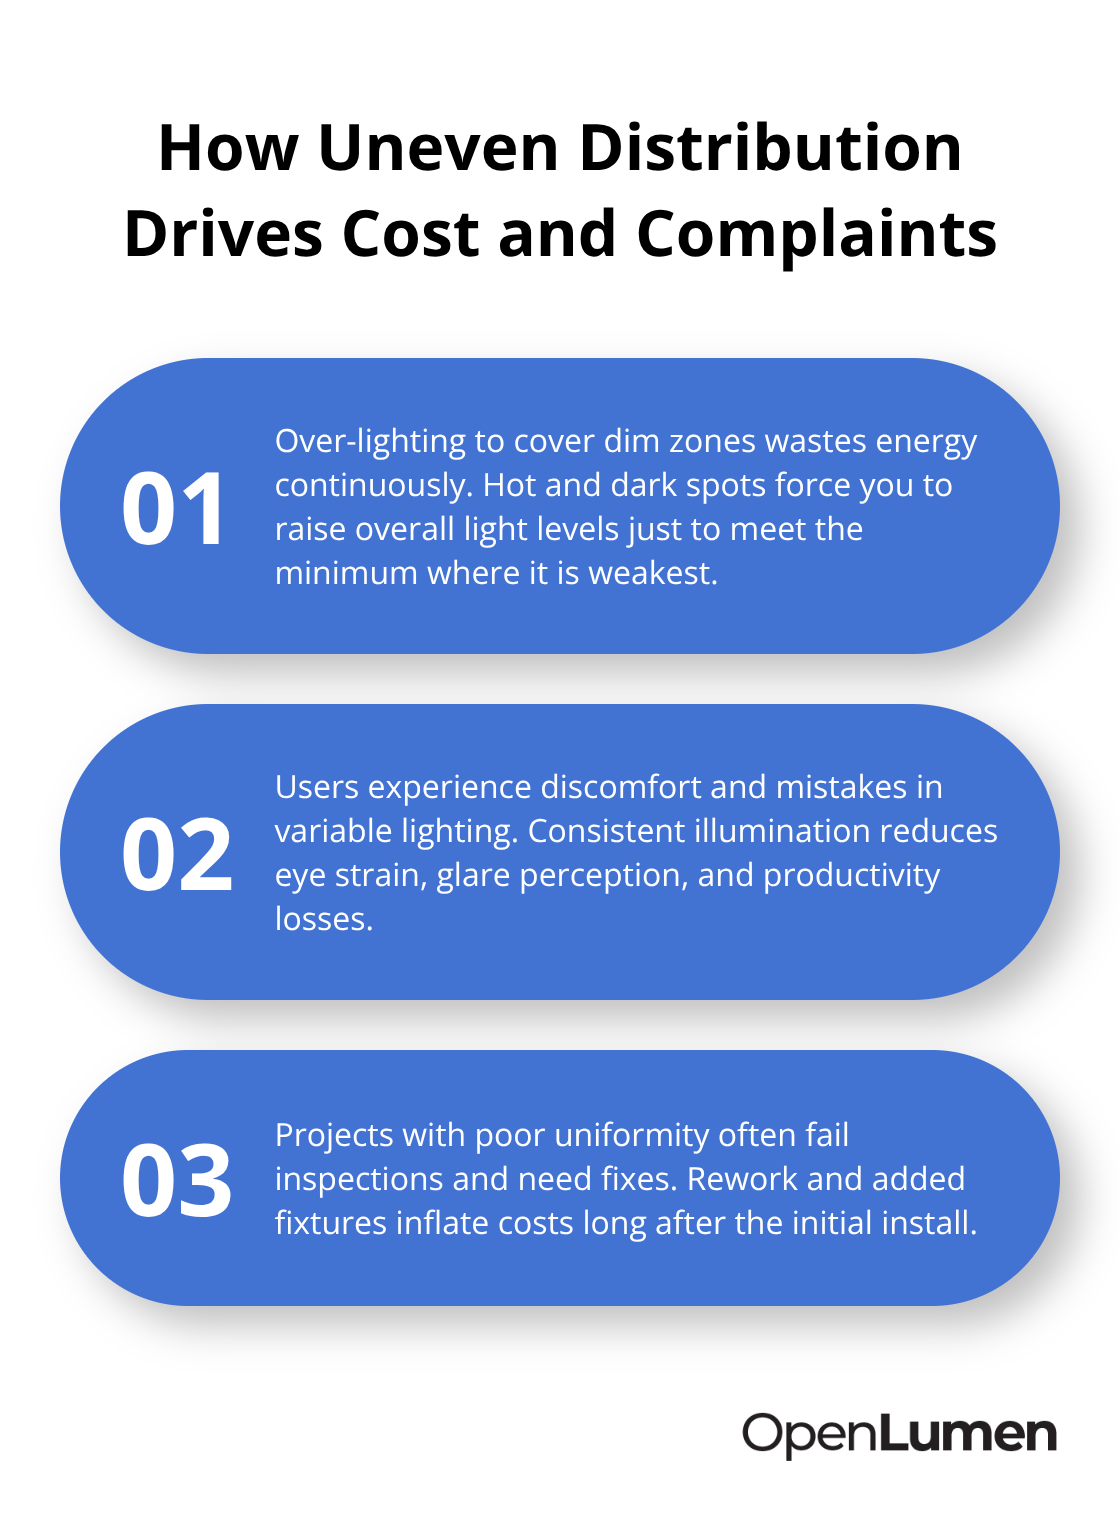
Dark areas also create safety risks. Employees working in under-lit zones experience eye strain, reduced visibility, and higher accident rates. In manufacturing environments where precision matters, uneven lighting causes quality issues and slows productivity. Inspectors catch these problems too. If your illuminance falls below code minimums in any zone, you fail inspection and face costly rework or fixture additions after installation.
How Poor Uniformity Violates Code and Frustrates Users
A parking garage with average illuminance of 8 foot-candles sounds adequate until someone measures the corners and finds only 2 foot-candles. That 4:1 ratio between max and min violates most jurisdictions’ uniformity standards, which typically target ratios around 3:1 to 4:1 for indoor spaces. Parking lots and exteriors allow wider ratios-up to 10:1 or 15:1 depending on your local code and IES RP-20 guidance-but even those limits get exceeded without planning.
Poor uniformity also increases perceived glare. When light levels vary dramatically across a space, your eyes constantly adjust, causing discomfort and fatigue. Customers at a car wash feel rushed when bright zones alternate with dim ones. Workers in a warehouse make more errors in low-light areas adjacent to bright sections. The solution isn’t adding more fixtures everywhere; it’s placing them strategically based on actual light distribution patterns.
Photometric Layouts Replace Guesswork with Precision
Photometric layouts eliminate the guessing game. A proper layout shows you exactly where foot-candles land on your work plane before you buy a single fixture or install any hardware. Instead of discovering problems after installation, you adjust fixture count, placement, or type during the design phase when changes are free.
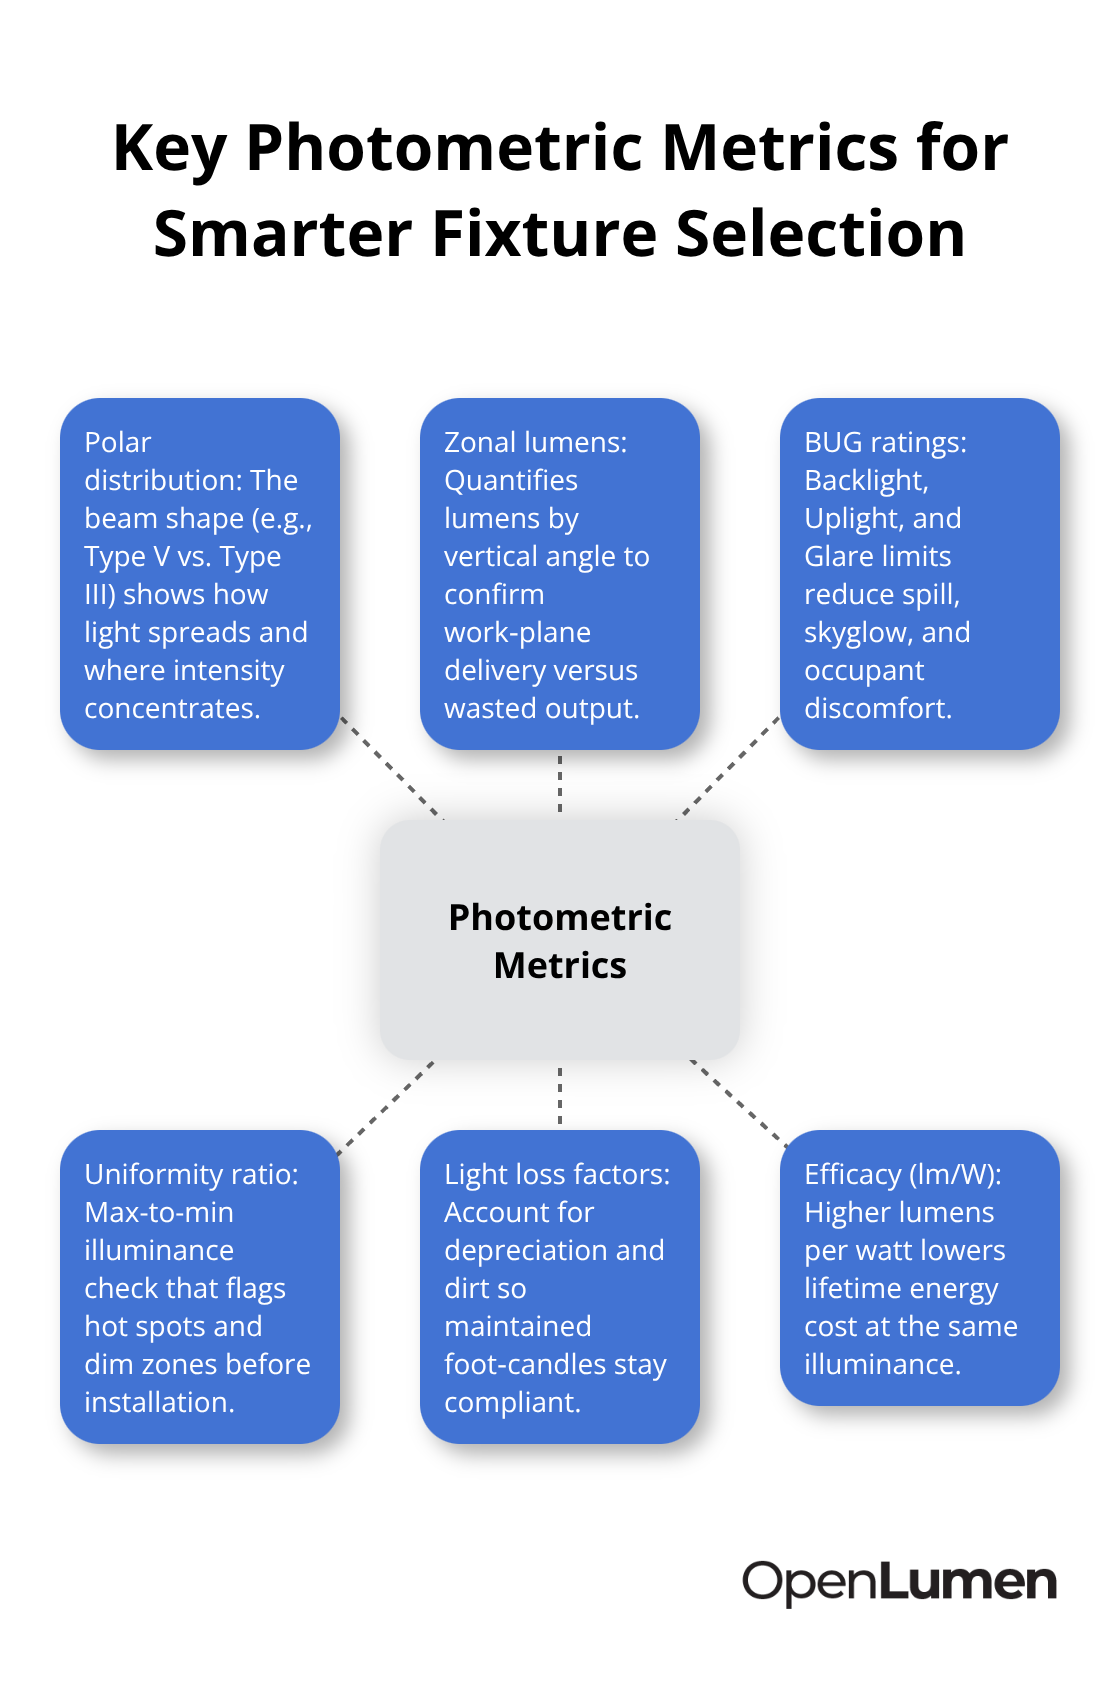
Polar charts from photometric reports reveal how each fixture’s light spreads-whether it throws light symmetrically (Type V distribution) or directionally (Type III). Zonal lumen data shows how many lumens reach each 10-degree vertical zone, helping you predict whether light reaches where you need it. A fixture that looks efficient on paper might waste light upward or to the sides if its distribution doesn’t match your space.
With visualization tools, you swap fixtures and re-run calculations to see results instantly. A warehouse manager can compare a 120-watt LED high bay against a 150-watt alternative and see exactly which delivers better uniformity at lower energy cost. This data-driven approach transforms fixture selection from a guessing game into a confident decision backed by real performance metrics.
Building Your Photometric Layout
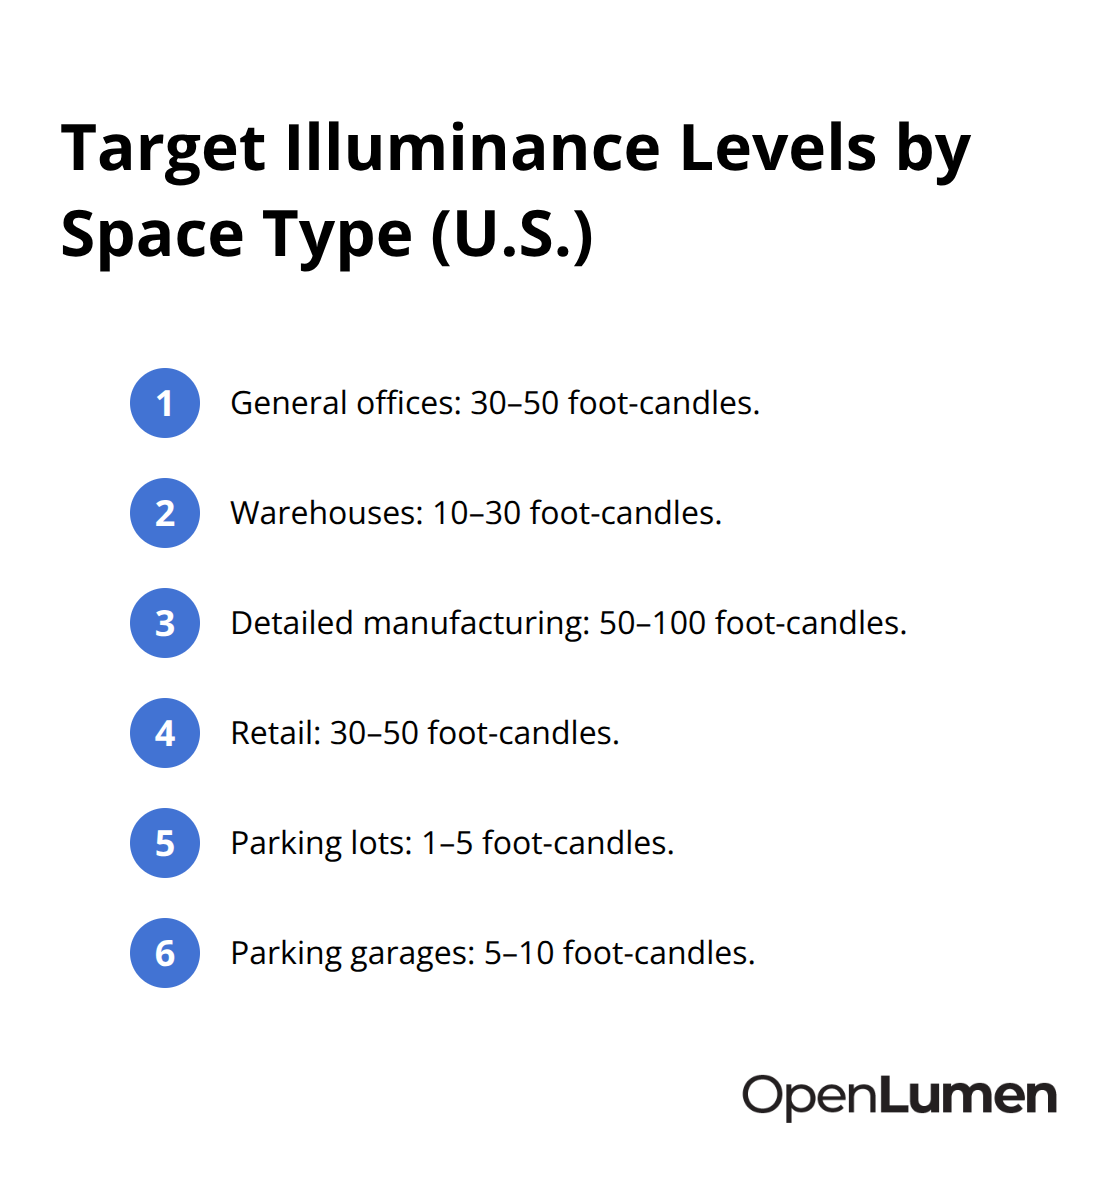
A photometric layout starts with three essential inputs: your floor plan or site drawing, fixture specifications with IES files, and target illuminance levels for each zone. Most designers measure their space first and determine what foot-candle levels each area requires. IES recommendations are clear-general offices need 30–50 foot-candles, warehouses 10–30, detailed manufacturing tasks 50–100, retail 30–50, parking lots 1–5, and parking garages 5–10.
Once you know your targets, you import IES files from manufacturers into design software and place fixtures on your floor plan. Each fixture becomes a data point. The software calculates illuminance at hundreds or thousands of points across the work plane, then displays the results as a foot-candle grid showing average, maximum, and minimum values. Inspectors verify this grid against code requirements. The uniformity ratio-maximum foot-candles divided by minimum foot-candles-tells you whether your distribution is even. Indoor spaces typically target 3:1 to 4:1; exterior parking and security areas allow 10:1 to 15:1 depending on jurisdiction and IES RP-20 guidance. If your ratio exceeds these limits, you adjust fixture placement or add units in dark zones until uniformity improves.
Real-Time Visualization Prevents Expensive Mistakes
The power of photometric layouts is that you see problems before construction starts. When you swap a 120-watt LED high bay for a 150-watt alternative, the software recalculates instantly and shows you the new foot-candle grid. A warehouse manager comparing fixtures discovers that the lower-wattage option delivers better uniformity because its beam angle matches the ceiling height better-saving energy without sacrificing coverage. This data-driven comparison prevents the common mistake of over-specifying wattage. Most projects without visualization end up brighter than necessary, consuming 20–30% more energy than required. Design tools now make this analysis accessible to contractors and distributors who previously relied on lighting designers. The best layouts also account for light loss factors-typically 0.7–0.85 for lumen depreciation and 0.85–0.95 for dust and dirt accumulation. Ignoring these factors overstates performance by roughly 15–30%, meaning your space dims noticeably within months if you don’t plan for it. A proper layout applies these factors upfront so your maintained foot-candles stay above code minimums throughout the fixture’s life.
Why Fixture Distribution Patterns Matter More Than Wattage
Two fixtures with identical wattage produce vastly different illuminance patterns because of their optical distribution. A Type V symmetric distribution throws light evenly in all directions and suits open warehouse floors. A Type III asymmetric distribution concentrates light forward and works better for roadways or parking lots where you need directional throw. Candela distribution polar charts reveal this pattern instantly. If you place a Type V fixture designed for open spaces in a narrow corridor, you waste light to the sides and under-light the length. Conversely, mounting a Type III roadway fixture in an open warehouse creates dark zones directly beneath it and bright rings around it. Reading the polar chart correctly-paying attention to the candela scale labels-prevents this mismatch. Zonal lumen data strengthens this analysis by showing how many lumens land in each 10-degree vertical zone from 0 to 180 degrees. A fixture with high zonal lumens in the 20–40 degree range reaches the work plane efficiently; one with most lumens above 60 degrees wastes light on walls and ceilings. This specificity is why proper fixture selection demands actual photometric data, not marketing claims about brightness.
Adjusting Your Layout Based on Performance Data
Once your software generates the foot-candle grid, you evaluate whether the results meet your targets and code requirements. If average illuminance falls short, you add fixtures or increase wattage. If uniformity ratios exceed acceptable limits, you reposition fixtures to fill dark zones rather than add more units everywhere. This iterative process-test, analyze, adjust-takes minutes with modern tools instead of weeks with manual calculations. You also compare efficacy across fixture options. A 150 lm/W fixture delivers roughly 50% more light per watt than a 100 lm/W alternative, directly affecting your energy costs over the fixture’s life. When you factor in light loss and lumen depreciation, the higher-efficacy option often costs less to operate despite a higher upfront price. Your photometric layout quantifies this trade-off so you make decisions based on total cost of ownership, not just purchase price. The foot-candle grid also reveals whether your design creates glare or discomfort. Dramatic variations between adjacent zones force occupants’ eyes to constantly readjust, causing fatigue. Even distribution-within your target uniformity ratio-improves user experience and reduces errors in task-critical environments.
From Layout to Installation Confidence
A completed photometric layout serves as your installation blueprint and your defense against code violations. Contractors follow the fixture placement shown on your plan, and inspectors verify that your calculated foot-candles match the documented grid. This documentation prevents costly rework after installation. You also use the layout to communicate with clients and stakeholders. Instead of abstract discussions about brightness, you show them the actual foot-candle values at specific locations and explain how uniformity affects their space. Property owners see exactly what they’re paying for, and facility managers understand maintenance schedules needed to preserve performance as lumens depreciate. The layout also supports rebate applications. Utility companies and energy programs require detailed fixture specifications, IES data, and calculated illuminance to approve incentives. A professional photometric layout includes all this documentation, streamlining the rebate process and recovering a portion of your project cost. With this foundation in place, you’re ready to analyze how specific performance metrics-like BUG ratings and polar distributions-further refine your design choices and maximize both efficiency and user satisfaction.
How to Read Polar Charts and Zonal Lumens for Smarter Fixture Placement
Understanding Polar Charts and Distribution Patterns
Polar charts display how a fixture’s light spreads across every angle-its optical fingerprint. The chart shows candela intensity (measured light output at specific angles) plotted on concentric rings. A Type V symmetric distribution produces a circular or oval shape with similar intensity in all directions, ideal for open warehouse floors where light needs to spread evenly. A Type III asymmetric distribution narrows dramatically, concentrating light forward like a spotlight, which suits roadways and parking lots where directional throw prevents wasted side light.
The candela scale matters enormously. Two identical-looking charts represent vastly different fixtures if one uses a 0–500 candela scale and another uses 0–2000. Always read the ring labels carefully. A fixture that appears efficient on a compressed scale might waste 40% of its light upward or sideways on a realistic scale.
Zonal Lumens Reveal Where Light Actually Lands
Zonal lumen data removes confusion by showing exactly how many lumens land in each 10-degree vertical zone from 0 to 180 degrees. A warehouse fixture with 8000 total lumens might deliver 3200 lumens in the 10–20 degree zone (where it reaches the work plane efficiently) and only 800 lumens above 60 degrees (mostly wasted on walls and ceiling). This breakdown lets you predict whether a fixture will actually illuminate your target area or squander energy on useless directions.
When you compare two fixtures with identical wattage, the one with higher zonal lumens in the 20–40 degree range performs better on your work plane. This specificity eliminates the mistake of choosing fixtures based on total lumens alone-a common error that leads to over-lit spaces and inflated energy bills.
BUG Ratings Quantify and Control Light Waste
BUG ratings (Backlight, Uplight, Glare) quantify light waste in three directions and directly control how much energy escapes where you don’t want it. Backlight measures lumens traveling more than 90 degrees from the fixture’s downward aim, typically wasted on the building facade or sky. Uplight measures lumens above 90 degrees, also wasted unless you specifically want ceiling or accent light. Glare measures high-intensity light in the 55–90 degree zone that causes discomfort to occupants below.
A parking lot fixture rated B3 U1 G2 emits less backlight, almost no uplight, and moderate glare-appropriate for parking. An identical fixture rated B5 U4 G4 wastes significantly more light and money. The Dark Sky Society and many jurisdictions now require BUG ratings below specific thresholds to limit light pollution and reduce energy waste.
Selecting Fixtures Based on Performance Metrics
A warehouse or parking lot retrofit that swaps fixtures with poor BUG ratings for optimized alternatives cuts wasted light by 30–50% without reducing illuminance on the work plane. When you run your photometric layout, select fixture options with low BUG ratings in the directions you don’t need light. This single decision often reduces total fixture count or wattage because you eliminate waste rather than compensating with more fixtures.
Most manufacturers now publish BUG data alongside polar charts. If yours doesn’t, request it or choose a supplier that prioritizes this transparency. Your photometric layout software should display BUG ratings alongside illuminance grids so you compare not just foot-candles but also efficiency and environmental impact.
Applying These Metrics to Your Design
Adjusting fixture selection based on three metrics-polar distribution shape, zonal lumen concentration, and BUG ratings-ensures your design delivers light exactly where needed. This approach minimizes operational costs and passes code compliance without overbuilding. You eliminate the guesswork that leads to over-specification and wasted energy. The combination of these data points transforms fixture selection from assumption into precision, letting you make confident decisions backed by real performance characteristics rather than marketing claims alone.
Final Thoughts
Lumen distribution planning transforms lighting from a guessing game into a data-driven process that saves money, improves safety, and passes inspections on the first try. Uneven illumination wastes 20–30% of energy, creates dark zones that violate code, and frustrates occupants-problems that proper photometric layouts eliminate by showing you exact foot-candle values, uniformity ratios, and fixture performance metrics before you commit to hardware. Fixture selection demands real data, not assumptions, so polar charts, zonal lumens, and BUG ratings replace wattage-based decisions that often lead to over-specification and inflated operational costs.
You start your next project by measuring your space, defining target illuminance levels for each zone, and importing manufacturer IES files into design software. Modern tools make this workflow accessible to contractors and distributors who previously relied on expensive consultants, and you adjust fixture placement and type in real time instead of waiting weeks for manual calculations. This speed lets you compare options confidently and present clients with data-backed recommendations that improve uniformity and user experience while reducing energy consumption.
OpenLumen streamlines this entire process with a free, browser-based platform that eliminates expensive software and steep learning curves. Its community-verified luminaires library and instant metrics give you polar charts, BUG ratings, and zonal lumens without leaving your browser, so you move from concept to installation with confidence and precision.
The information provided is for general educational purposes only and should not be considered professional engineering or lighting design advice. Always verify project requirements, local codes, and specifications with qualified professionals before making final decisions.