Polar charts are one of the most misunderstood tools in lighting design. Most people glance at them and move on, missing critical information that directly impacts project success.
At OpenLumen, we’ve seen countless lighting decisions fail because teams didn’t properly interpret polar chart data. The good news: reading and applying these charts is simpler than you think, and it transforms how you select fixtures and predict light distribution.
What Polar Charts Actually Reveal About Light
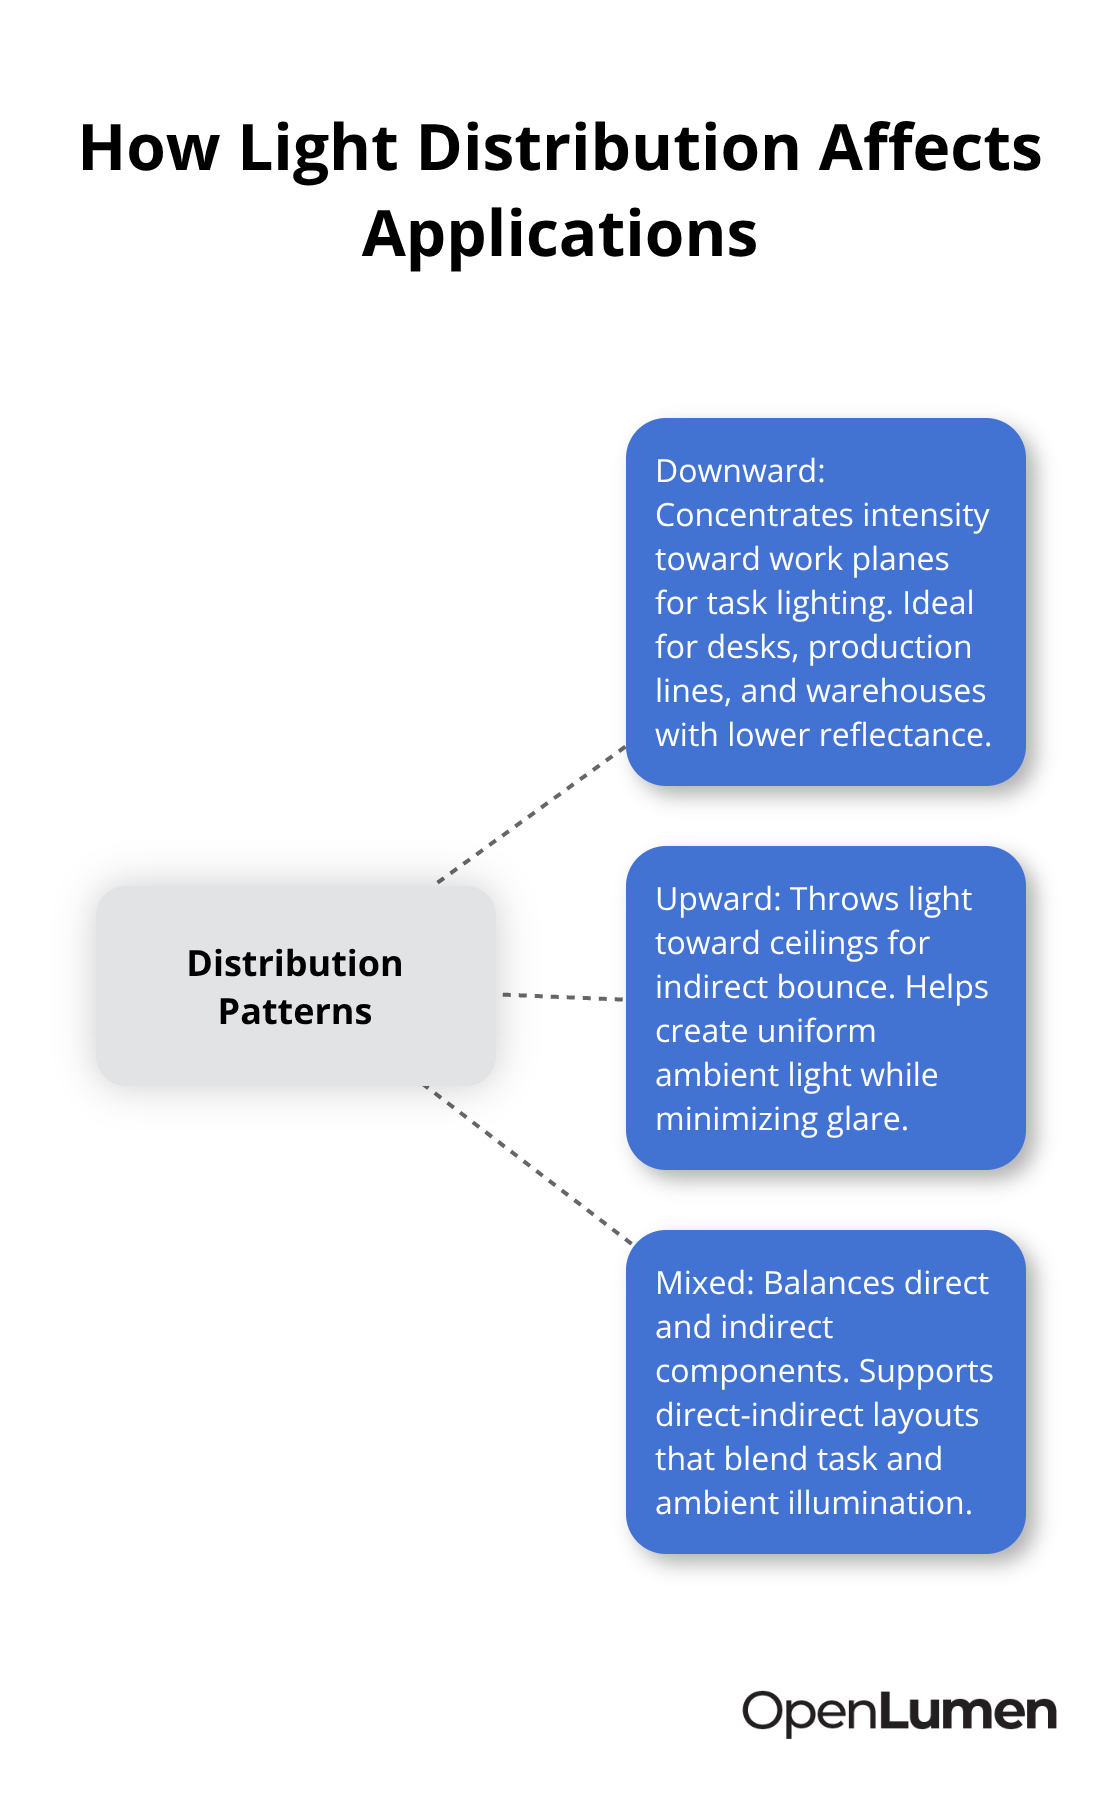
A polar chart translates how a fixture distributes light in three-dimensional space into a two-dimensional diagram you can read in seconds. The distance from the center represents luminous intensity in candelas, while the angle shows direction. Gamma measures elevation-0 degrees points downward toward floors and work surfaces, while 180 degrees points upward toward ceilings. The C-plane defines horizontal orientation, rotating around the fixture’s mounting axis. This matters because most lighting failures stem from mismatched fixtures. A fixture optimized for downward illumination performs poorly on a ceiling bounce application, and you learn this too late only when the space feels dim or unevenly lit. Contractors and distributors who read polar data upfront avoid costly fixture swaps and client complaints. The chart shows immediately whether intensity concentrates downward (gamma 0–90 degrees), upward (gamma 90–180 degrees), or both. Downward-heavy distributions suit task lighting on desks and work planes. Upward distributions support indirect ceiling-bounce systems. Mixed patterns enable direct-indirect approaches that balance ambient and task light. Without this information, you’re essentially guessing.
How Intensity Patterns Predict Real Performance
The shape of a polar diagram reveals fixture behavior that specification sheets bury in dense tables. A symmetric, circular pattern indicates omnidirectional spread-useful for pendant fixtures over islands or general ambient lighting. An asymmetric pattern with peaks and valleys shows where the fixture concentrates energy and where it drops off. Asymmetry often indicates the need for diffusers or mounting adjustments to achieve even coverage. Many contractors overlook asymmetry and end up with hot spots or dark corners. The practical action: compare the polar shape to your room layout. If you need even light across a 20-foot-wide retail space, an asymmetric fixture with narrow peaks creates uneven brightness. A wider, flatter distribution works better.
Reading Zonal Lumens and Beam Angles
Zonal lumens-the total light output within specific gamma ranges-let you quantify performance. A fixture might output 3,000 lumens total, but only 1,500 lumens downward (gamma 0–90). If your design requires 2,000 downward lumens for adequate task lighting, that fixture fails. Reading zonal values prevents undersized installations. Beam angle, typically defined at 50 percent intensity, tells you the spread width. A 20-degree beam concentrates light in a tight column; a 60-degree beam spreads wider. Narrow beams work for accent or spot lighting; wide beams suit general illumination. Matching beam angle to your coverage area ensures sufficient brightness without dark edges.
Why Polar Data Beats Lumens Alone
Lumen ratings tell you total light output but nothing about where that light goes. Two fixtures with identical lumen counts distribute light completely differently. One might flood a space evenly; the other might create bright spots with dark gaps. This distinction determines whether your design succeeds. When you rely only on lumen counts and wattage, you design blind. Polar charts add the directional intelligence lumens lack. A 2,000-lumen downlight with gamma concentration at 45 degrees performs vastly differently from a 2,000-lumen fixture with even distribution across 120 degrees. Spacing calculations demand polar data. Industry practice recommends fixture spacing of 1.2 to 1.5 times mounting height for even light. That rule only works if you know the beam angle and intensity pattern. Without polar information, you space fixtures arbitrarily and hope. Validation becomes impossible. Once you install, you cannot easily verify the design matches intentions without illuminance measurements. Polar charts let you predict outcomes before installation. You adjust fixture placement and see the impact on illuminance maps before ordering anything. This shift from guesswork to data-driven design eliminates surprises and rework costs.
How to Read Polar Charts Without Guessing
Extract Intensity Patterns and Match Them to Your Space
Polar charts only work if you extract the right information and apply it to your specific space. Most contractors stop after glancing at the shape, but that’s where the real work starts. The intensity pattern tells you where light concentrates, and you must match that concentration to your room geometry. If you light a 30-foot-long warehouse with a 15-foot ceiling, a fixture with downward intensity peaking at 45 degrees works well. That same fixture performs poorly in a 12-foot-tall retail space where you need broader, more even distribution.
The gamma range showing peak intensity provides your first data point. If the polar chart shows intensity concentrated between gamma 20 and 60 degrees, the fixture throws light moderately downward-ideal for general illumination on work planes. If intensity peaks near gamma 90 degrees, you’re looking at near-horizontal throw, which suits wall washing or indirect ceiling bounce.
Account for Asymmetric Patterns and C-Plane Orientation
Asymmetric patterns reveal a critical detail: one side of the fixture throws harder than the other. This happens with linear fixtures or asymmetric reflectors designed for specific mounting positions. Rotating the fixture 180 degrees changes performance entirely. Many contractors install asymmetric fixtures without accounting for orientation, then wonder why one side of the space is brighter.
The fix requires checking the C-plane values-the horizontal orientation angles. Most photometric data includes C0, C90, C180, and C270 readings. If C0 shows 2,500 candelas and C180 shows only 1,200 candelas, you have significant asymmetry. Install the fixture with C0 pointing toward your primary work area, or you waste intensity in the wrong direction.
Translate Zonal Lumens into Actionable Fixture Selection
Zonal lumens are where polar data becomes actionable. The photometric report breaks total output into gamma zones: typically 0-30 degrees (direct downward), 30-60 degrees (moderate downward), 60-90 degrees (near horizontal), and 90-180 degrees (upward or backward). A 4,000-lumen fixture might distribute as 1,600 lumens in the 0-30 zone, 1,200 in the 30-60 zone, 800 in the 60-90 zone, and 400 upward. That distribution suits task-focused applications. A different 4,000-lumen fixture might split 1,000-1,000-1,000-1,000 across the same zones, providing more balanced ambient light. Your space demands determine which fixture wins.
Verify Beam Angle Against Actual Polar Data
Beam angle definitions mislead contractors regularly because manufacturers use different conventions. Some define beam angle at 50 percent intensity, others at 10 percent. A 40-degree beam at 50 percent intensity extends much tighter than a 40-degree beam at 10 percent. Always verify the intensity threshold used in the spec sheet.
The practical approach: ignore the marketing beam angle number and read the polar chart directly. Draw an imaginary line at 50 percent of peak intensity and measure the angle spread. That’s your real beam angle for spacing calculations. If peak intensity is 3,000 candelas and your reference point is 1,500 candelas, trace where 1,500 intersects the polar plot and measure the angle. Most contractors miscalculate spacing because they trust beam angle numbers without validating them against the actual polar data.
Spacing rules like 1.2 to 1.5 times mounting height assume a specific beam angle and intensity distribution. When you deviate from standard fixtures, those rules fail. The only reliable method is plotting illuminance using the polar data. You adjust fixture spacing and see the impact on brightness distribution before installation. Without that analysis, you’re back to guessing.
Avoid Common Mistakes That Waste Light and Create Dark Spots
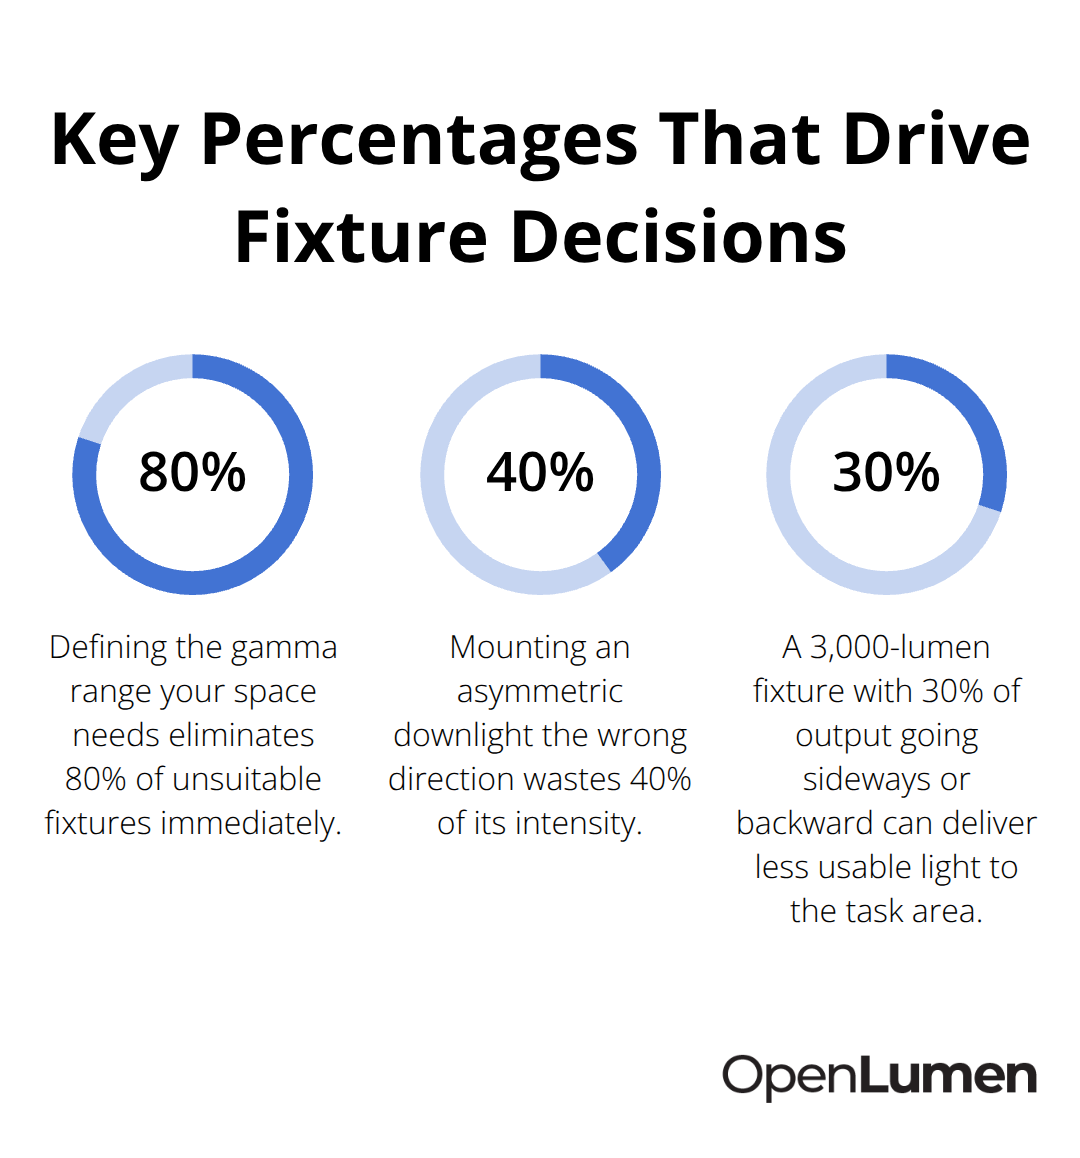
Common mistakes happen when contractors compare fixtures using only total lumens and ignore polar distribution entirely. A 3,000-lumen fixture with tight downward concentration delivers more usable light to a work surface than a 3,500-lumen fixture with 30 percent of output going sideways or backward. Intensity direction matters far more than lumen count.
Another frequent error: assuming all downlights perform the same. A standard downlight might have gamma peak at 35 degrees, while a wide-distribution downlight peaks at 60 degrees. Installing them on the same 8-foot spacing produces completely different results. The tight downlight creates bright spots under each fixture; the wide one blends into even ambient light. Reading the polar chart prevents this mismatch and ensures your fixture selection actually delivers the light distribution your space requires.
From Polar Data to Fixture Selection
Selecting the right fixture starts with matching polar performance to your actual space requirements, not chasing lumen counts. Most contractors approach this backward: they pick a fixture based on wattage or total lumens, then hope it performs well. Polar charts force you to work forward instead.
Define Your Space Requirements First
Start by defining what your space demands. A warehouse with 20-foot ceilings and dark concrete floors needs downward intensity concentration between gamma 30 and 60 degrees to reach work surfaces efficiently. A retail showroom with 10-foot ceilings and reflective ceilings benefits from broader distribution and some upward throw for indirect bounce. A residential kitchen requires balanced direct-indirect performance to avoid harsh shadows on countertops.
Once you define the gamma range your space needs, you eliminate 80 percent of unsuitable fixtures immediately. This clarity prevents wasted time evaluating fixtures that cannot meet your actual requirements.
Calculate Zonal Lumens and Filter Candidates
Next, calculate the minimum zonal lumens required. If your work plane sits 3 feet above floor level and requires 500 lux illumination across a 15-foot-wide area, you need roughly 2,000 lumens in the downward gamma zone (0–90 degrees). A fixture delivering 3,500 total lumens but only 1,200 downward lumens fails, regardless of how impressive the total number sounds.
Check the photometric data for zonal lumen breakdowns. Most manufacturers now publish these in the 0–30, 30–60, 60–90, and 90–180 degree ranges. Compare the downward zonal total (0–90 degrees) against your calculated requirement. If the fixture underperforms, move to the next candidate. This filtering step prevents undersized installations and eliminates the guesswork that leads to retrofit costs.
Account for Asymmetric Fixtures and Orientation
Asymmetric fixtures demand extra attention because orientation determines everything. If you select an asymmetric downlight designed for wall washing, mounting it pointing the wrong direction wastes 40 percent of its intensity. Check the C-plane values in the photometric report.
If C0 shows significantly higher intensity than C180, you have strong asymmetry. Mark which direction is C0 and ensure your installation plan rotates the fixture accordingly.
For linear fixtures over long corridors or retail shelves, asymmetry often works in your favor. A fixture designed with peak intensity toward the shelf front and reduced intensity toward the wall behind prevents glare while maximizing product visibility. The key is intentional placement based on polar data, not accidental misalignment.
Predict Illuminance Distribution Using Polar Data
Once you select your fixture, predicting actual illuminance distribution requires translating polar intensity values into real-world brightness levels. Illuminance at any point depends on three factors: luminous intensity in that direction, distance from the fixture, and the angle of incidence on the surface. Polar charts provide the intensity component; you supply distance and geometry.
For a quick estimate, use the inverse square law: illuminance equals intensity divided by distance squared. A fixture with 1,500 candelas in a given direction, mounted 10 feet above a work surface, produces roughly 15 lux at that point. Most contractors skip this calculation and space fixtures based on rules of thumb. That approach fails when ceiling heights vary, surfaces have different reflectance, or fixture performance deviates from standard assumptions.
The more reliable method involves plotting illuminance maps using photometric data. Tools that accept polar data let you upload fixture information, define room geometry, and see illuminance distribution in real time. You adjust fixture spacing, count, and aiming, then watch how brightness changes across the space. This immediate feedback eliminates surprises and validates designs before ordering. Most contractors who adopt this workflow report 30 to 40 percent faster design cycles because they avoid the trial-and-error phase that traditional specifications demand.
Validate Your Design Before Installation
Validating design decisions against polar data separates professional installations from mediocre ones. After you design the layout, always compare your fixture selection and spacing against the polar performance you claimed to use. Does the fixture you specified actually have the downward concentration you assumed? Does the spacing align with the beam angle shown in the polar chart? Are asymmetric fixtures oriented correctly on your drawings? These details sound minor until you stand in a finished space that feels dim or uneven because a detail was overlooked.
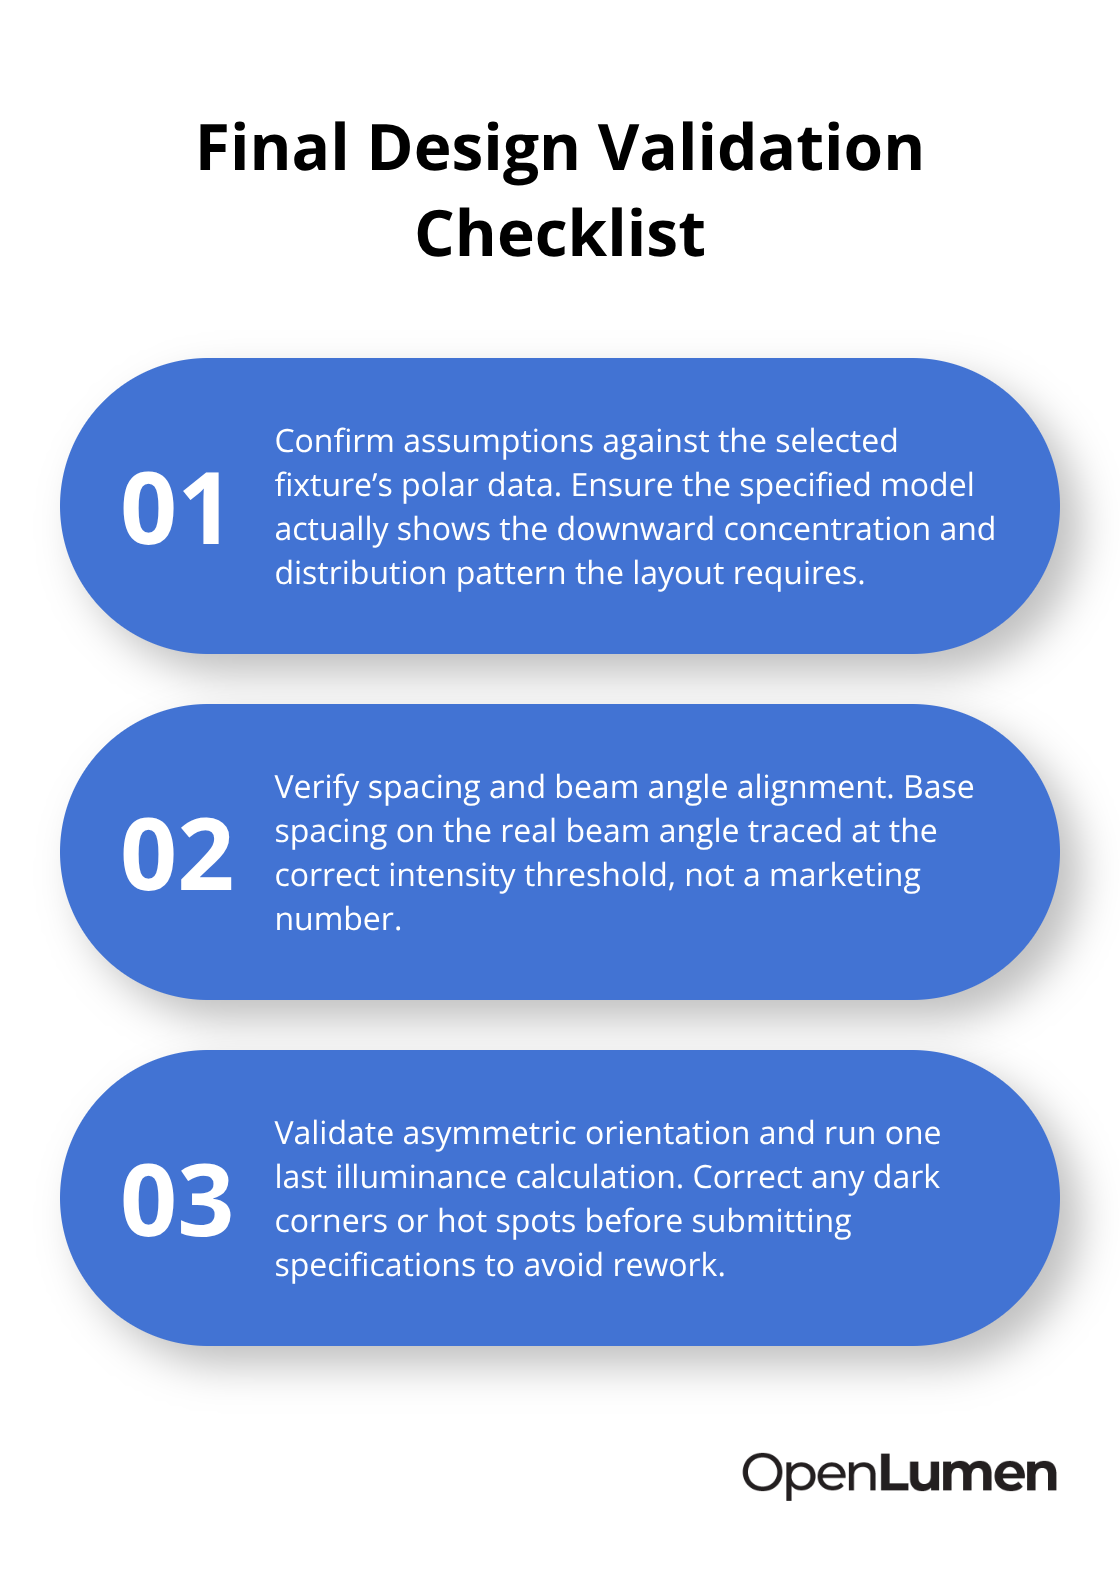
Run an illuminance calculation one final time before submitting specifications to the client. If the calculation shows dark corners or hot spots, adjust spacing or fixture selection now rather than discovering the problem after installation. This validation step takes 15 minutes and prevents thousands in rework costs. Contractors who skip it inevitably face callback complaints and fixture swaps that damage reputation and margins.
Final Thoughts
Polar chart data interpretation transforms lighting design from guesswork into predictable, measurable outcomes. Intensity direction matters far more than lumen count-a fixture with 3,000 lumens concentrated downward outperforms a 4,000-lumen fixture with scattered distribution when your space demands task lighting on work surfaces. Reading gamma ranges, zonal lumens, and beam angles from polar data lets you make that comparison in minutes instead of discovering performance gaps after installation.
Asymmetric fixtures, C-plane orientation, and spacing calculations all depend on polar information. Skipping this analysis guarantees callbacks, fixture swaps, and damaged margins. Validating your design against polar data before ordering eliminates these problems entirely-the 15 minutes spent on illuminance calculations saves thousands in rework costs and protects your reputation.
Tools that streamline this process let you upload polar data, define room geometry, and see illuminance distribution instantly. You adjust spacing and fixture selection in real time, then generate professional reports that validate your decisions to clients. Your lighting projects now rest on a foundation built on data, not assumptions, which translates into faster sales cycles, fewer complaints, and installations that perform exactly as designed.
The information provided is for general educational purposes only and should not be considered professional engineering or lighting design advice. Always verify project requirements, local codes, and specifications with qualified professionals before making final decisions.