Photometric data errors slip through design reviews every day, and they cost real money when projects reach the construction phase. A single mistake in light distribution data can trigger budget overruns, compliance failures, and costly rework.
At OpenLumen, we’ve seen how proper photometric data validation catches these problems early, before they become expensive. This guide shows you exactly how to validate your data and build a workflow that prevents costly mistakes.
Why Photometric Data Errors Cost Real Money
Uplight and Stray Light Inflate Project Costs
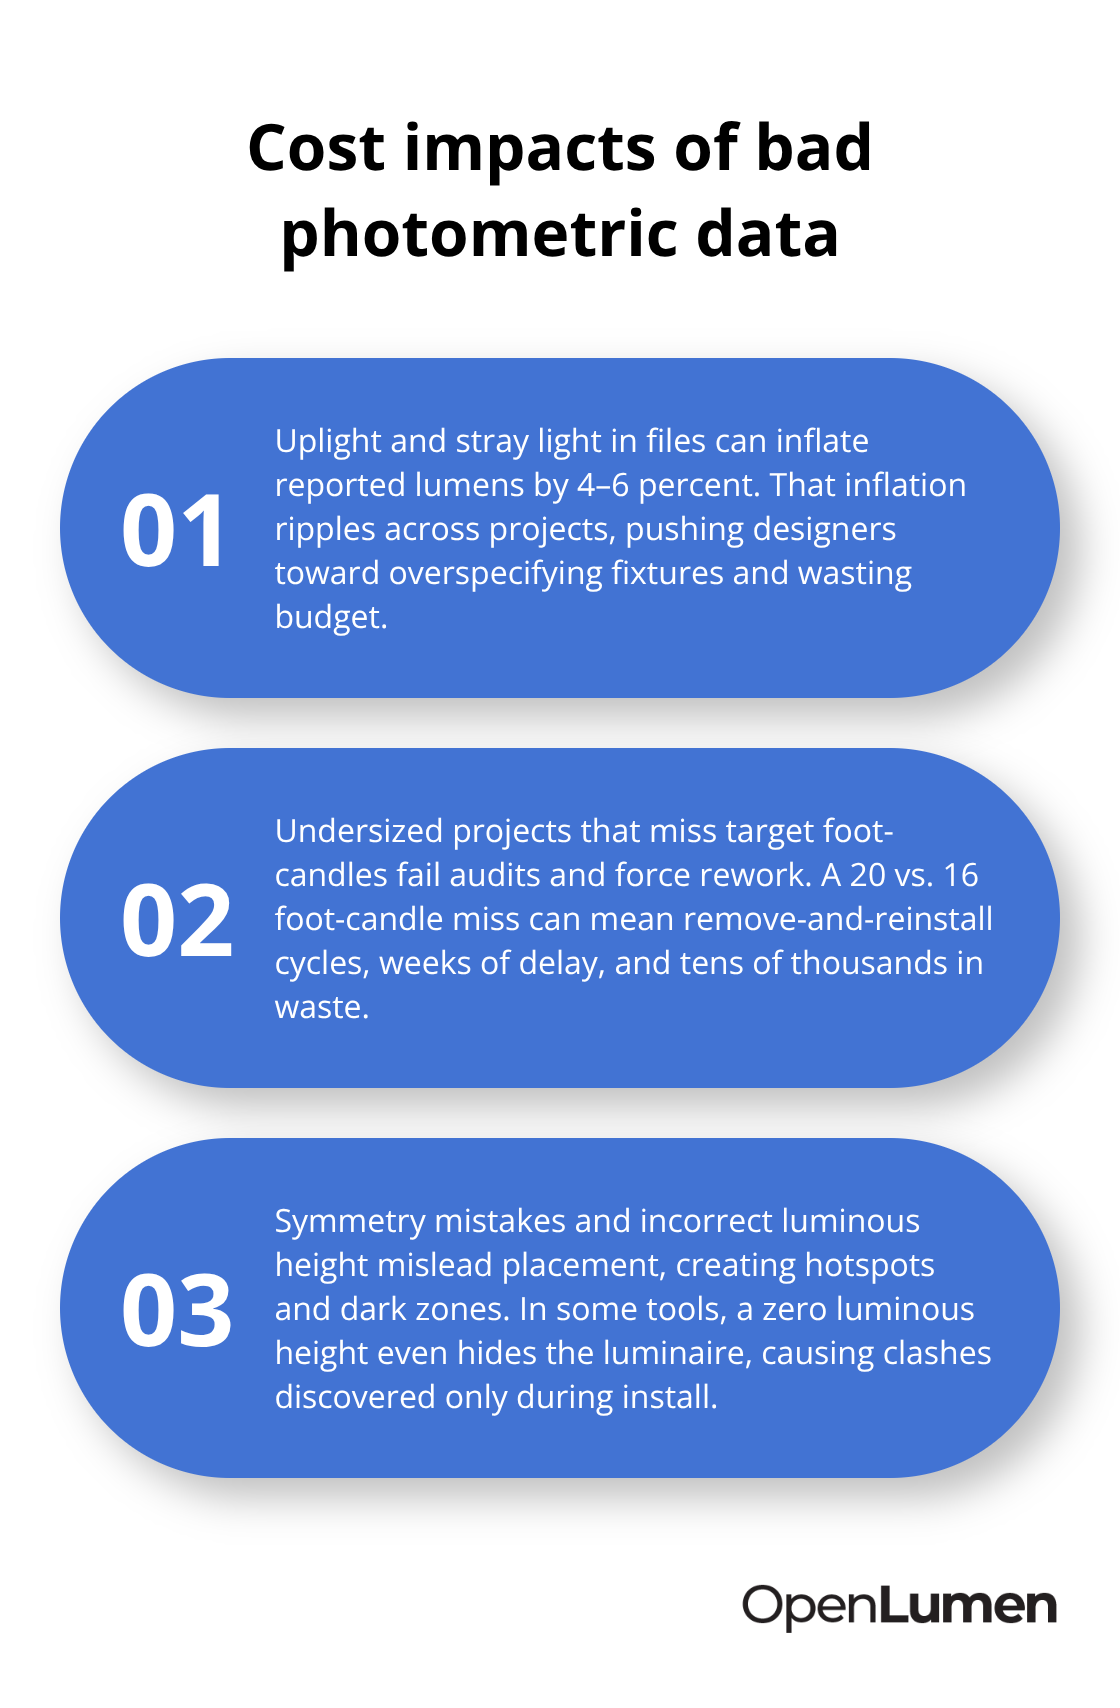
Uplight and stray light in photometric data files inflate lumen output by 4–6 percent in sealed-back downlights and high-bay configurations. Industry analysis of common LDT and IES files shows this problem occurs regularly. This seemingly small error compounds across a multi-fixture project. A designer who specifies 40 fixtures based on inflated data may install 10–15 percent more fixtures than necessary to hit illuminance targets, wasting thousands in hardware and labor costs.
Undersized Projects Trigger Expensive Rework
Undersized projects fail compliance audits and force costly corrections. A warehouse lighting layout that appears to meet 20 foot-candles on paper but delivers only 16 foot-candles in practice triggers a rework order: remove fixtures, reinstall, re-test, and re-certify. That single validation failure costs two to four weeks and tens of thousands in labor and material waste.
Symmetry Errors Create Uneven Illumination
Missing or misapplied symmetry in photometric data misleads designers into poor fixture placement. When a file claims symmetry but the actual production run varies, the layout achieves uneven illumination with hotspots and dark zones that violate uniformity targets. Incorrect luminous height-especially a zero value-renders the luminaire invisible in certain design software views, causing layout interference with ducts, cable trays, or structural members that only surface during installation.
File Naming and Geometry Problems Block Progress
Long file names and catalogue numbers that exceed Windows path limits or software import tolerances create silent failures where the data file refuses to load, forcing designers to hunt for alternate files or re-enter data manually. Glare calculations (UGR) based on wrong luminous dimensions or missing symmetry produce noncompliant results on paper, then fail real-world testing because the actual fixture geometry differs from what the software modeled.
Compliance Bodies Now Require Independent Validation
Compliance bodies now require independent validation of photometric data before sign-off, meaning projects without validated files face rejection at inspection. The cost extends beyond rework-it includes project delay, lost credibility with clients, and strain on team resources. These problems surface only when validation happens too late. The solution is simple: validate photometric data upfront, before it shapes your entire design.
How to Validate Photometric Data Before Design Lockdown
Validate photometric data the moment you receive an IES file from a manufacturer, not after your layout is complete. Open the file in your design software and cross-check the summary data against the manufacturer’s published specification sheet. The cover page should list total luminaire lumens, input wattage, luminaire efficacy in lumens per watt, correlated color temperature, color rendering index, and rated life in L70 or L90 hours. If the IES file shows 85 lumens per watt but the spec sheet claims 110, stop and request the correct file. Efficacy mismatches signal either outdated data, wrong wattage configuration, or stray light correction errors baked into the file.
Many manufacturers publish IES files for every product configuration on their websites. If a file is unavailable, that’s a red flag about transparency. Request the exact file for your catalog number, wattage, and optic before proceeding. Do not assume one IES file covers all variants of a product line.
Compare Polar Patterns to Real Fixture Behavior
The candela distribution curve in your photometric report shows luminous intensity at all angles. A tight peak at 0 degrees indicates a narrow downlight suitable for 25–40 foot mounting heights, while a batwing pattern spreads light wider for lower ceiling heights and broader coverage. Plot the polar pattern alongside your room geometry and verify the beam spread matches your mounting height and spacing.
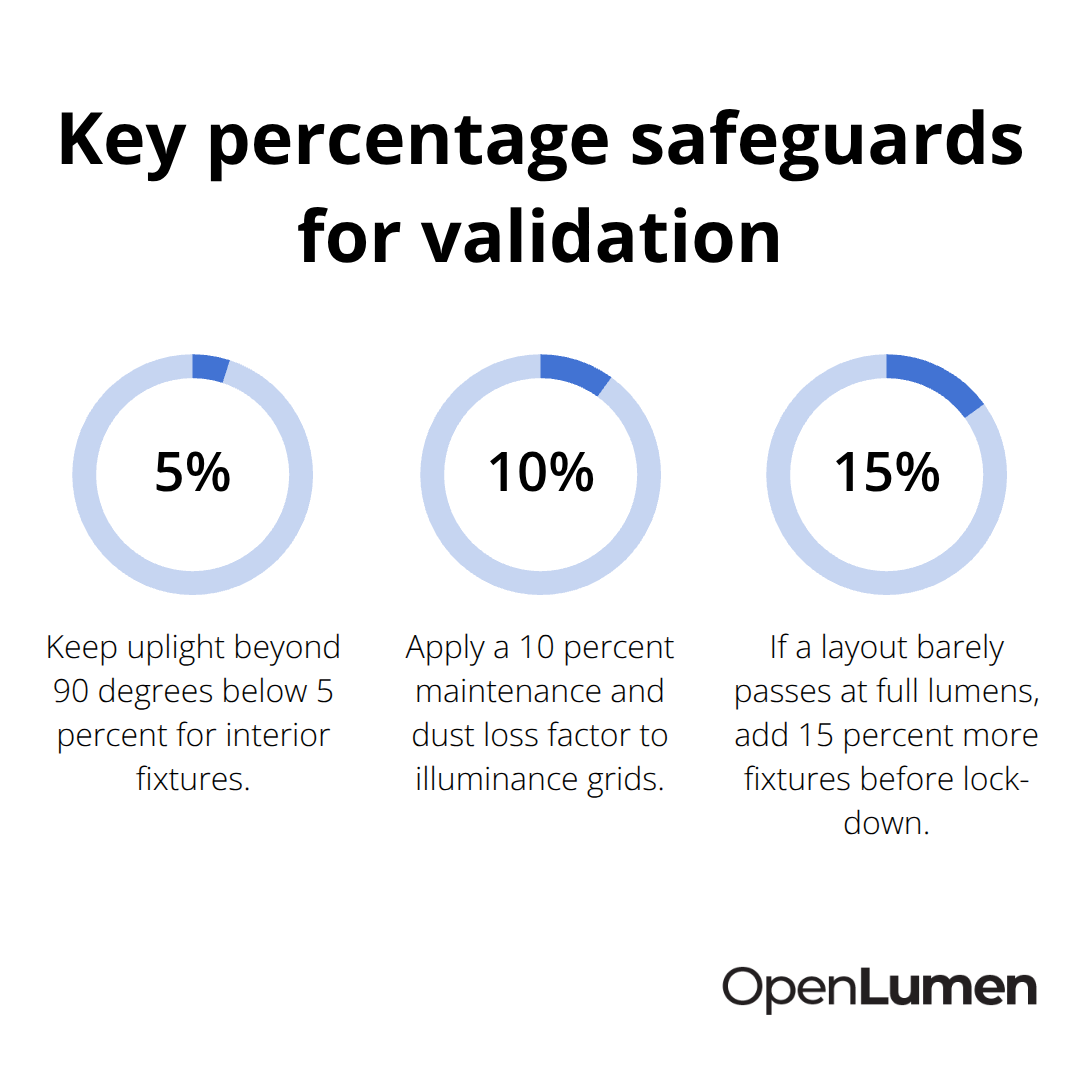
Zonal lumen summaries break total light into angular zones: 0–30 degrees, 0–60 degrees, 0–90 degrees, and 90–180 degrees. For interior fixtures, uplight beyond 90 degrees should stay below 5 percent of total output. If a file shows 8–12 percent uplight, the data likely includes stray light from the test setup that wasn’t corrected, inflating your lumen count.
Outdoor fixtures require BUG ratings from the Illuminating Engineering Society. A fixture rated B3-U2-G3 means backlight, uplight, and glare are each rated 3 on a 0–5 scale. Many municipalities cap these values at B2-U1-G2. Cross-check the BUG rating against your local code before specifying the fixture.
Run Illuminance Grids in Your Actual Space
Calculate foot-candles on your work plane using the illuminance grid provided in the photometric report, then adjust for your actual mounting height using this formula: predicted foot-candles multiplied by the square of the reference height divided by your actual height. A typical office requires 30–50 foot-candles with 3 to 1 uniformity between the brightest and darkest points. A warehouse needs 10–30 foot-candles with the same uniformity ratio.
If your simulation shows 35 foot-candles average but 18 foot-candles in the corners, you’ve failed the uniformity target and need more fixtures or repositioning. Run the calculation twice: once with the manufacturer’s stated lumens and once reduced by 10 percent to account for age, dust, and maintenance losses. If the reduced scenario still meets code, your design is robust. If it barely passes with full lumens, you’ll face compliance problems within two years.
These validation checks catch data problems before they cascade into layout errors and budget overruns. The next section shows you which tools and workflows automate this process and integrate validation into your design software.
Automate Validation Into Your Design Workflow
Open IES Files and Scan for Red Flags
Design software like DIALux and AGi32 import nearly any valid IES file without warning when data is incorrect. The software assumes your file is correct and proceeds to calculations. You need a separate validation step before the file enters your layout. Open the IES file in a text editor and scan the header for red flags. The file should state the test lab name, accreditation number (NVLAP for US labs), test date, and total lumens on the first page. Missing accreditation or a test date older than three years signals that the data may not reflect current production.
Cross-Check Software Metrics Against Spec Sheets
Import the file into your design software and compare the summary metrics against the manufacturer’s published spec sheet. If the software reports 2,850 lumens but the spec sheet claims 3,100, request the exact configuration file for your catalog number and wattage. Many manufacturers publish multiple versions of the same product with different optics and drivers, and loading the wrong file cascades through your entire layout.
Test Illuminance in Your Actual Space
Run an illuminance grid calculation in a test room matching your actual space dimensions, then reduce the result by 10 percent to simulate three years of dust and maintenance losses. If the reduced scenario still meets code, your design survives real-world conditions. If it barely passes at full lumens, add 15 percent more fixtures now rather than rework later. This validation takes 20–30 minutes per fixture type and prevents thousands in rework costs.
Document Validation Decisions for Compliance
Export your illuminance grid with average, minimum, and maximum foot-candles clearly labeled, then add a note stating the test conditions, reduction factor applied, and code compliance confirmation. Include the polar chart from the photometric report and highlight the zonal lumens breakdown to show uplight remains below 5 percent for interior work. For outdoor fixtures, document the BUG rating and cross-reference it against your local municipal code to confirm approval.
Build a Validation Checklist Your Team Repeats
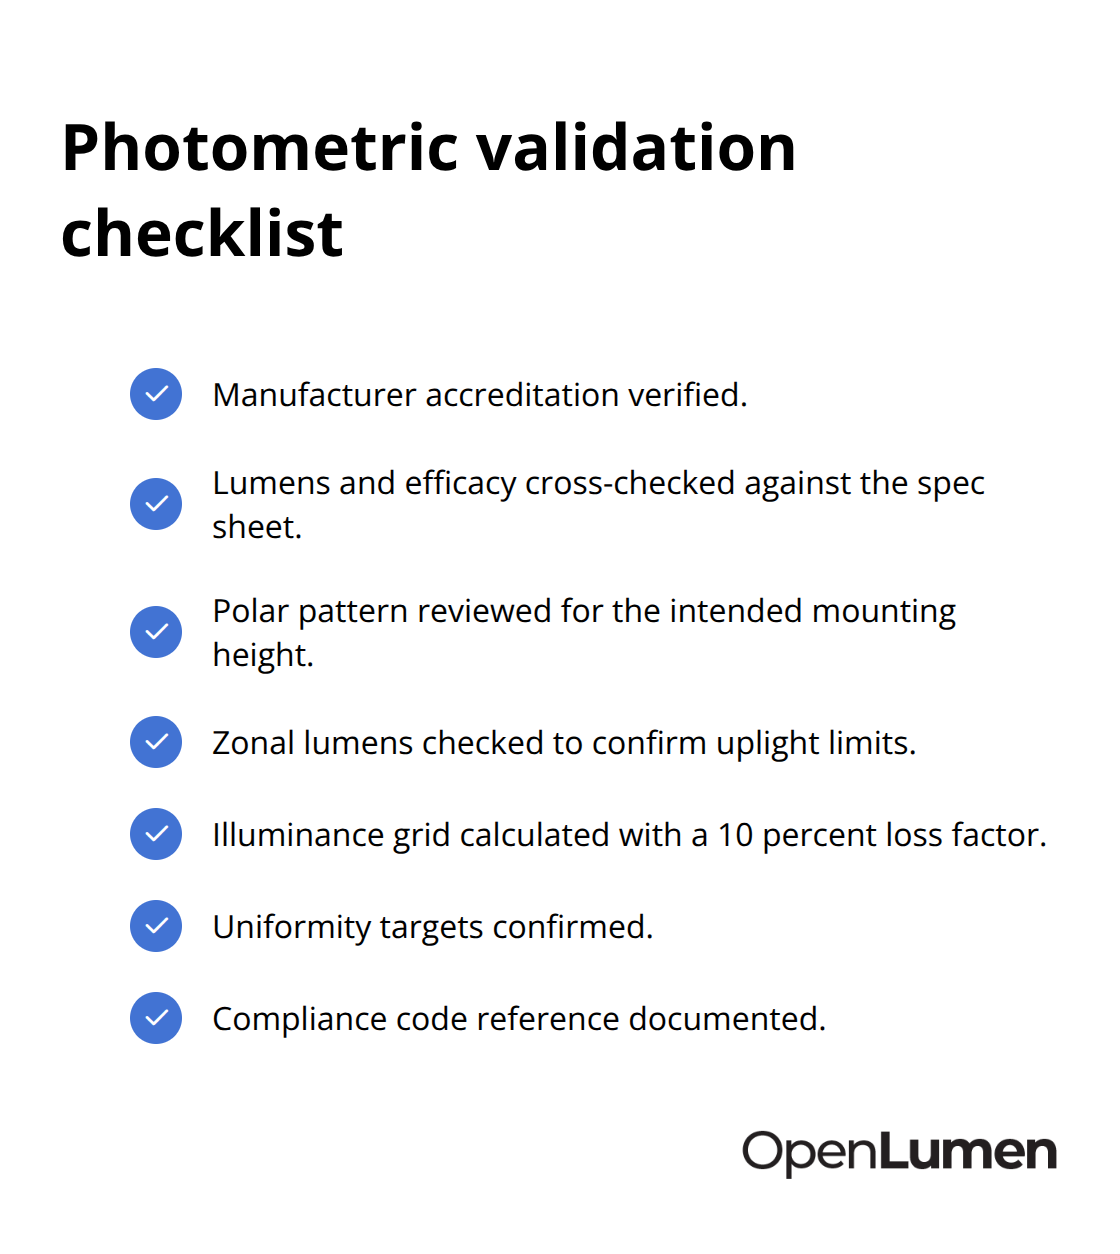
Create a validation checklist that your team completes for every IES file: manufacturer accreditation verified, lumens and efficacy cross-checked, polar pattern reviewed for your mounting height, zonal lumens checked for uplight, illuminance grid calculated with 10 percent loss factor, uniformity targets confirmed, and compliance code reference documented. Save this checklist as part of your project file so future team members understand which data was validated and when. Contractors and distributors who integrate this validation step into their workflow close sales faster because clients see documented proof that the lighting meets code before installation begins.
Property owners gain confidence that their investment delivers the promised performance without surprise rework orders.
Conclusion
Photometric data validation stops expensive mistakes before they reach the job site. When you validate upfront, you catch inflated lumens, symmetry errors, and compliance gaps while changes still cost nothing. The contractors and distributors who build validation into their workflow close projects faster because clients see proof that the lighting meets code before installation begins.
Start with a simple checklist: verify manufacturer accreditation on every IES file, cross-check lumens and efficacy against the spec sheet, review polar patterns for your mounting height, and run an illuminance grid with a 10 percent loss factor to simulate real-world conditions. Document these decisions in your project file so your team understands which data was validated and when. This takes 20–30 minutes per fixture type and prevents thousands in rework costs.
OpenLumen is a free, browser-based platform that lets you create photometric layouts, run real-time illuminance analysis, and generate professional reports without expensive software. Its community-verified luminaires library and instant photometric metrics streamline the design-to-install workflow so your team can validate lighting faster and with confidence.
The information provided is for general educational purposes only and should not be considered professional engineering or lighting design advice. Always verify project requirements, local codes, and specifications with qualified professionals before making final decisions.