Photometric data is the foundation of every lighting design. When specifications don’t match reality, projects fail-budgets blow up, timelines slip, and your reputation takes a hit.
At OpenLumen, we’ve seen countless installations go wrong because teams trusted unverified numbers. The good news: verification of photometric data is straightforward once you know what to check and how to validate it.
What Photometric Data Actually Reveals
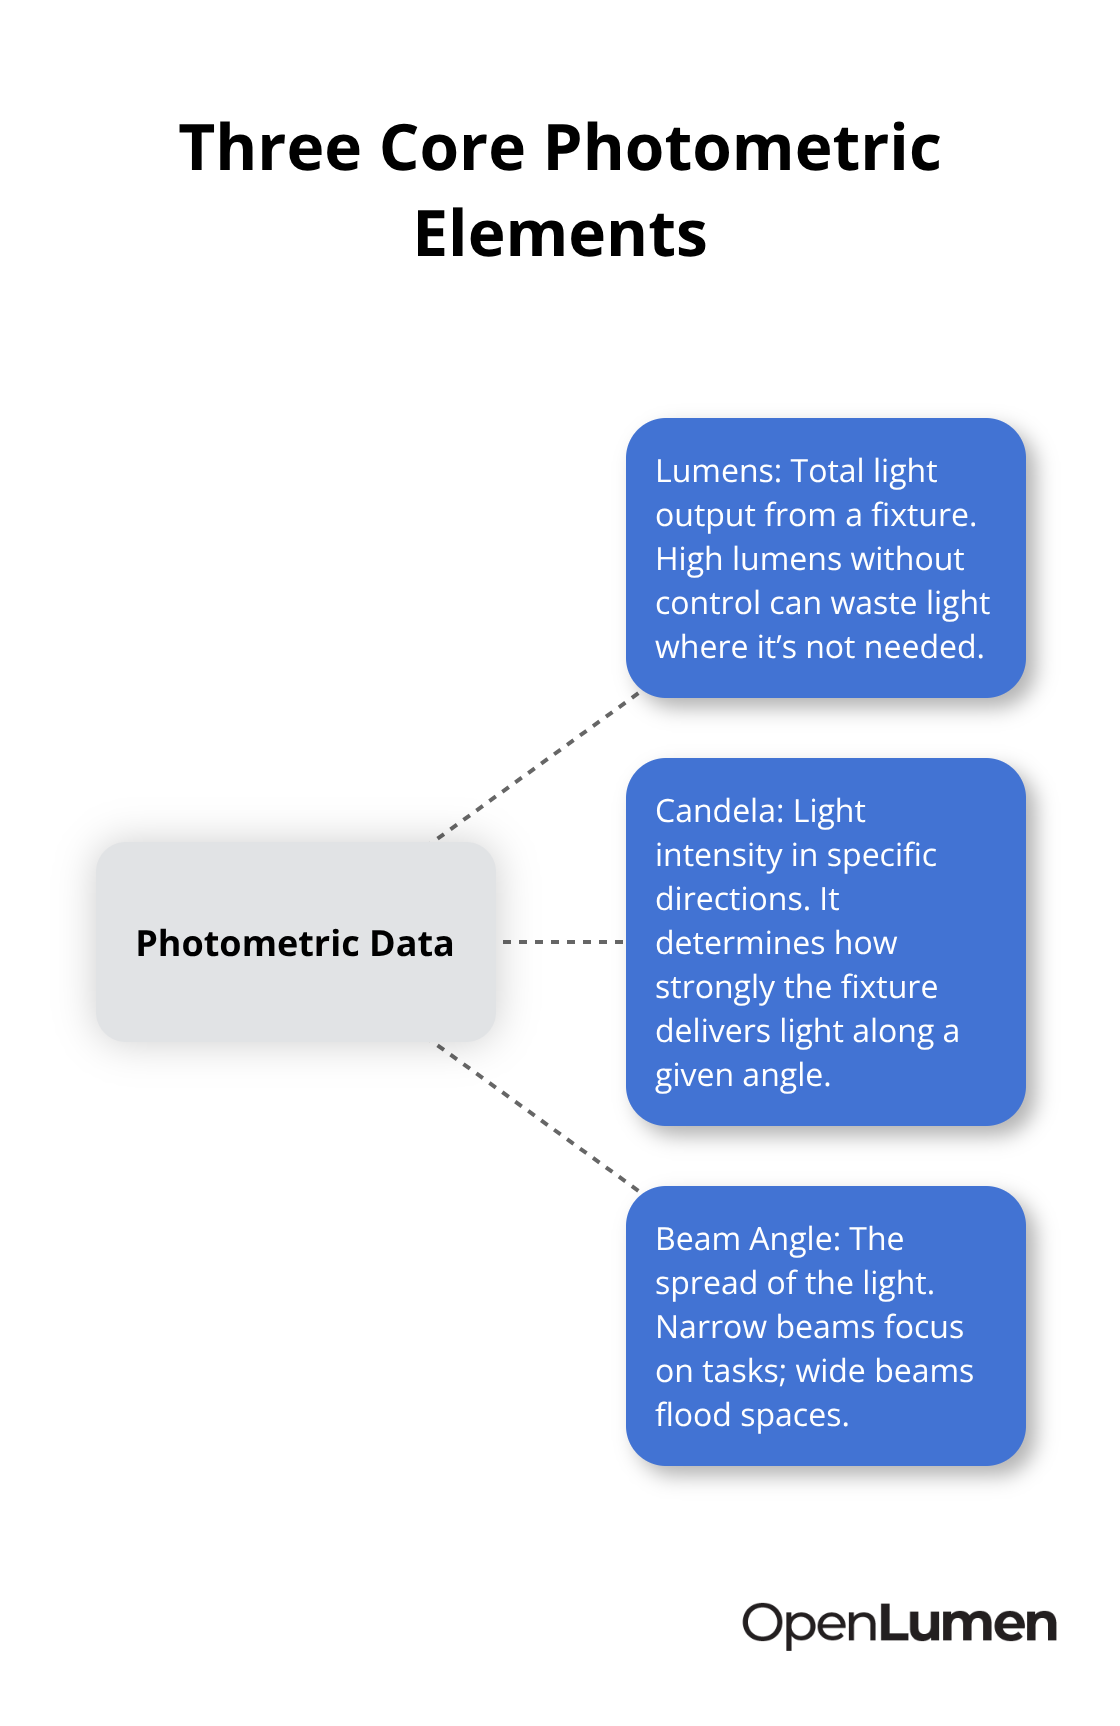
Photometric data tells you exactly how a fixture will perform in a real space-not just how bright it claims to be. Three elements matter: lumens (total light output), candela (light intensity in specific directions), and beam angle (how wide the light spreads). High lumen output alone means nothing if the light spreads in the wrong direction or misses your target area entirely.
A 5,000-lumen fixture with a 120-degree beam angle floods a room with unfocused light, while a 3,000-lumen fixture with a 30-degree beam angle concentrates light exactly where you need it for task work. Wattage fails as a design metric-a 50-watt LED outperforms a 100-watt fluorescent, yet contractors still specify fixtures based on power consumption instead of photometric output. The real numbers come from testing standards like LM-79 (luminous flux and color), LM-63 (photometric data file format), TM-30 (color rendering), and IEC 62471 (photobiological hazard assessment). Without these, you have no proof the fixture delivers what the manufacturer claims.
Where Specifications Go Wrong
Stray light in laboratory testing inflates lumen counts by 5 to 15 percent depending on the test setup. A goniophotometer with poor light absorption reflects unwanted photons back into measurements, making fixtures appear more efficient than they actually are. NIST research shows that even a few percent stray light can skew energy estimates significantly-critical when net-zero or LENI calculations depend on accurate efficiency data. Symmetry errors create another silent killer: asymmetrical photometric data indicates manufacturing variation or test setup problems, yet many files ship without correction. This causes uneven illumination in the field, with bright patches and dark zones that contradict design predictions. Luminous dimension errors are equally damaging-when the actual light-emitting area differs from what the data claims, glare calculations (UGR) become meaningless and CAD layouts fail to integrate properly with building services like sprinklers and HVAC ducts. IES files often omit luminous height entirely, leaving designers guessing about fixture geometry. LDT format includes both physical and luminous dimensions, which is why cross-checking between formats during conversions reveals inconsistencies that single-format reviews miss.
Why Unverified Data Breaks Projects
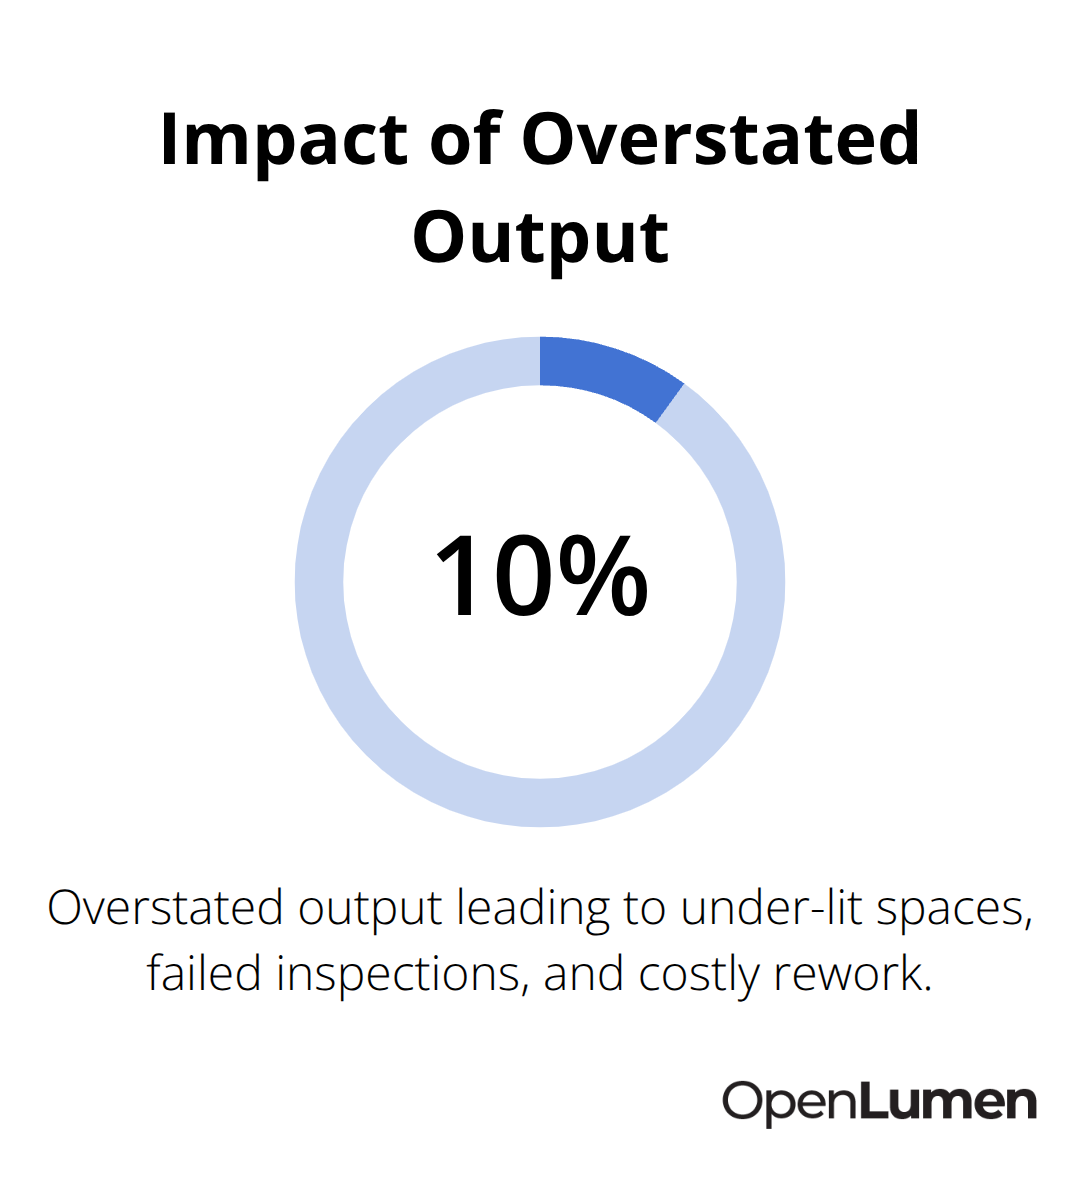
A contractor installs 80 fixtures based on photometric data that overstates output by 10 percent. The space ends up under-lit, task areas fail inspection, and now the contractor rewires everything at cost. The client files a claim, timelines slip six weeks, and relationships fracture.
Unverified data also creates cascading problems: if you trust inflated lumen numbers, you under-size fixtures and over-rely on quantity to compensate. If you miss asymmetry, certain zones stay dark while others glare. If you ignore luminous dimensions, your BIM model clashes with structural elements, forcing field modifications. Verification isn’t optional-it’s the difference between a project that lands on schedule and budget versus one that becomes a liability. Cross-checking photometric data against standards like IES, EULUMDAT, and CIBSE TM-14 catches errors before installation. Comparing multiple fixtures side-by-side reveals performance gaps that single-file reviews miss. The cost of verification is hours; the cost of failure is thousands in rework and reputation damage.
How to Start Validating Today
You don’t need expensive lab equipment to catch photometric errors. Request LM-63 files from manufacturers and compare them against published test reports-mismatches signal red flags. Use software tools to cross-check specifications: convert between IES and LDT formats and look for dimension inconsistencies or symmetry problems. Run side-by-side comparisons of candidate fixtures to spot performance gaps before you commit to a purchase. Field measurements validate whether installed fixtures match their rated output-a simple illuminance meter at key task points reveals whether the space meets design targets. These checks take minutes and prevent costly rework. The next step involves understanding which laboratory standards and certifications actually matter, and how to read them correctly.
How to Verify Photometric Data Before Installation
Standards That Matter
Verification starts with knowing which standards matter and what they actually test. LM-79 measures luminous flux and color properties in a lab setting, while LM-63 defines the file format that holds photometric data-both are non-negotiable for any fixture claiming ENERGY STAR or DLC eligibility. TM-30 replaces outdated CRI color rendering metrics with a more accurate picture of how a fixture handles color, and IEC 62471 assesses photobiological hazard risk so you know the fixture is safe for human exposure. A manufacturer shipping LM-79 results without an LM-63 file hasn’t completed the verification chain, which means no listing program will accept it and you have no standardized data to work with in design software.
Reading Test Reports Correctly
Request the actual test report from an accredited lab-NIST-traceable testing partners like Intertek provide detailed breakdowns of luminous flux, beam angles, and color rendering that expose stray light errors, symmetry problems, and dimension mismatches that raw manufacturer specs hide. When you examine a test report, look for stray light correction notation; labs that don’t quantify or correct stray light inflate efficiency numbers by 5 to 15 percent depending on their setup, which NIST research confirms distorts net-zero energy calculations significantly. Symmetry statements matter too-if the report doesn’t mention whether data was symmetrised to reflect average production, asymmetrical output hides in the file and causes uneven illumination in the field.
Field Measurements Validate Lab Data
Field measurements validate that installed fixtures actually deliver rated output, which catches problems that lab testing alone cannot reveal. Use an illuminance meter at task points-desks, countertops, emergency exit signs-and compare readings against design predictions; gaps larger than 10 to 15 percent signal either fixture degradation, optical misalignment, or data inflation during testing. This step protects your project from the silent failures that specifications alone miss.
Software Tools Accelerate Verification
Software tools accelerate verification without requiring field visits for every project. Convert IES files to LDT format and compare the results; dimension inconsistencies appear immediately, revealing whether luminous height or physical size data was omitted or misreported. Side-by-side fixture comparisons in design software show performance gaps that single-file reviews miss-run two candidate fixtures through the same space model and the intensity distribution differences become visual and undeniable.
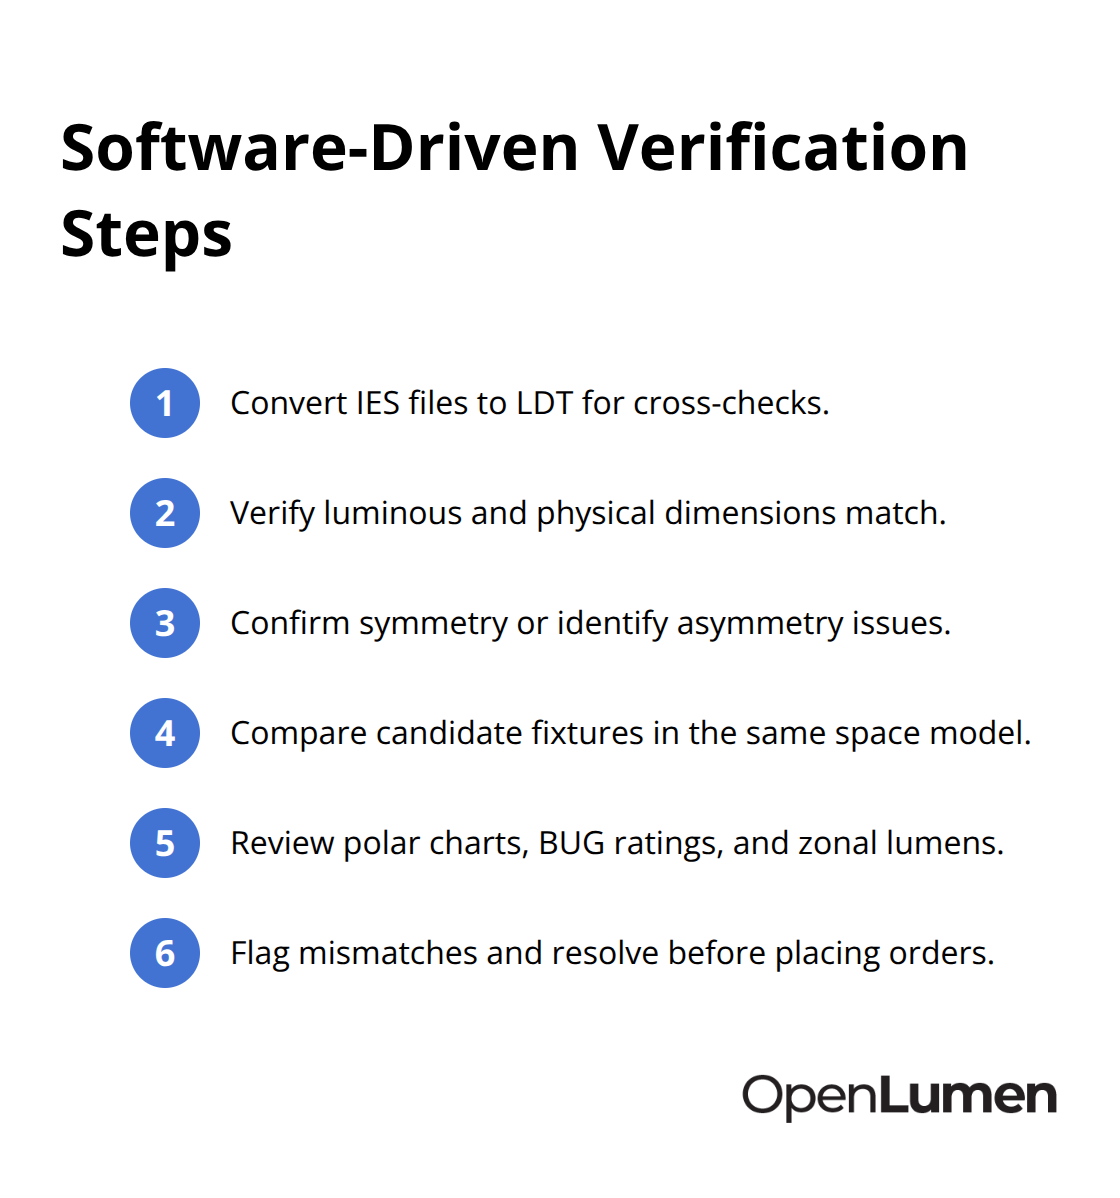
Tools that provide instant photometric metrics like polar charts, BUG ratings, and zonal lumens let you cross-check published specs against actual data files before committing to an order.
Cross-Check Everything
Don’t trust a single format or a single test report; cross-checking between IES and LDT, comparing lab results against field measurements, and validating data through multiple software tools catches the errors that single-method reviews let slip through. The verification process you choose determines whether your designs land on budget or spiral into costly rework. Once you’ve validated your photometric data, the next step is building trust in your entire luminaire library and establishing relationships with manufacturers who prioritize transparency.
Building Trust in Your Luminaire Selection
Source Fixtures from Transparent Manufacturers
Verification of photometric data matters only if you work with manufacturers and suppliers who make transparency non-negotiable. The best way to accelerate your verification process is to source fixtures from suppliers who have already vetted their luminaire data against industry standards and maintain complete documentation. When a manufacturer provides LM-79 test reports alongside LM-63 files, TM-30 color rendering data, and IEC 62471 safety assessments, you’re looking at a supplier who understands that incomplete data creates liability. Request these documents before you commit to a fixture-not after. A manufacturer who hesitates or claims the data is proprietary signals that verification will be difficult later.
Verify Lab Accreditation and Testing Rigor
The fixtures you specify should come with full traceability to NIST-calibrated testing, which means the lab performing the measurements maintains calibration services through institutions like NIST. This matters because NIST’s Photometry Project maintains national calibration standards and provides measurement assurance programs that help labs ensure their equipment is accurate. When you see a test report from an accredited lab, verify that the lab participates in proficiency testing programs-NIST’s Solid State Lighting Measurement Assurance Program has validated over 200 customers worldwide, and that level of oversight reduces the risk of inflated efficiency claims or hidden stray light errors.
Create an Audit Trail with Complete Documentation
Document everything in your design files. Store LM-63 files, test reports, and field measurement data together so that anyone reviewing your project later can see exactly which fixtures you specified and why. This creates an audit trail that protects you if performance questions arise months after installation. Tools that provide instant access to photometric metrics like polar charts, BUG ratings, and zonal lumens let you compare candidate fixtures without waiting for lab reports.
Validate Performance in the Field
Real-world performance validation requires one final check: after installation, measure illuminance at task points using a simple meter and compare the results against your design predictions. If readings fall within 10 to 15 percent of your calculated values, the photometric data held up in the field. If gaps exceed 15 percent, investigate whether fixtures were installed at the wrong height, optical elements degraded during shipping, or the original data overstated output. This field validation step takes minutes per location and catches problems that lab testing alone cannot reveal.
Build Relationships with Verified Luminaire Sources
When you work with verified luminaire libraries-sources that maintain complete documentation and link every fixture to traceable test data-you eliminate the verification guesswork. The combination of transparent suppliers, complete documentation, and field validation transforms photometric verification from a compliance burden into a competitive advantage that keeps your projects on schedule and your reputation intact.
Final Thoughts
Verification of photometric data separates projects that succeed from those that fail. Every hour you invest in validating fixture specifications before installation saves weeks of rework and protects your reputation with clients. When you cross-check test reports, compare formats, and measure performance in the field, you take control of your lighting outcomes and eliminate the guesswork that leads to under-lit spaces, budget overruns, and broken timelines.
The manufacturers and suppliers you work with set the tone for how easy verification becomes. Those who provide complete LM-79 test reports, LM-63 files, TM-30 color data, and IEC 62471 safety assessments signal that they understand the cost of failure. Those who withhold documentation or claim data is proprietary tell you that verification will be difficult later, so choose your sources carefully and verification becomes routine rather than a burden.
Your photometric confidence grows when you build systems around validated data and maintain complete documentation (store test reports, field measurements, and design files together so your entire team knows exactly which fixtures you specified and why). Tools that provide instant access to photometric metrics like polar charts, BUG ratings, and zonal lumens accelerate your verification process without requiring expensive software or specialized training. OpenLumen streamlines this workflow by combining a community-verified luminaires library with instant photometric metrics and real-time illuminance analysis, so you can design, validate, and install with confidence.
The information provided is for general educational purposes only and should not be considered professional engineering or lighting design advice. Always verify project requirements, local codes, and specifications with qualified professionals before making final decisions.