Poor lighting layouts drain budgets through wasted energy, installation delays, and costly rework. Most projects fail because fixtures are spaced wrong, coverage is uneven, or the design wasn’t validated before installation starts.
At OpenLumen, we’ve seen how efficient lighting layout design transforms projects. The right approach cuts waste, speeds installation, and delivers better results from day one.
Why Poor Layouts Cost You More Than You Think
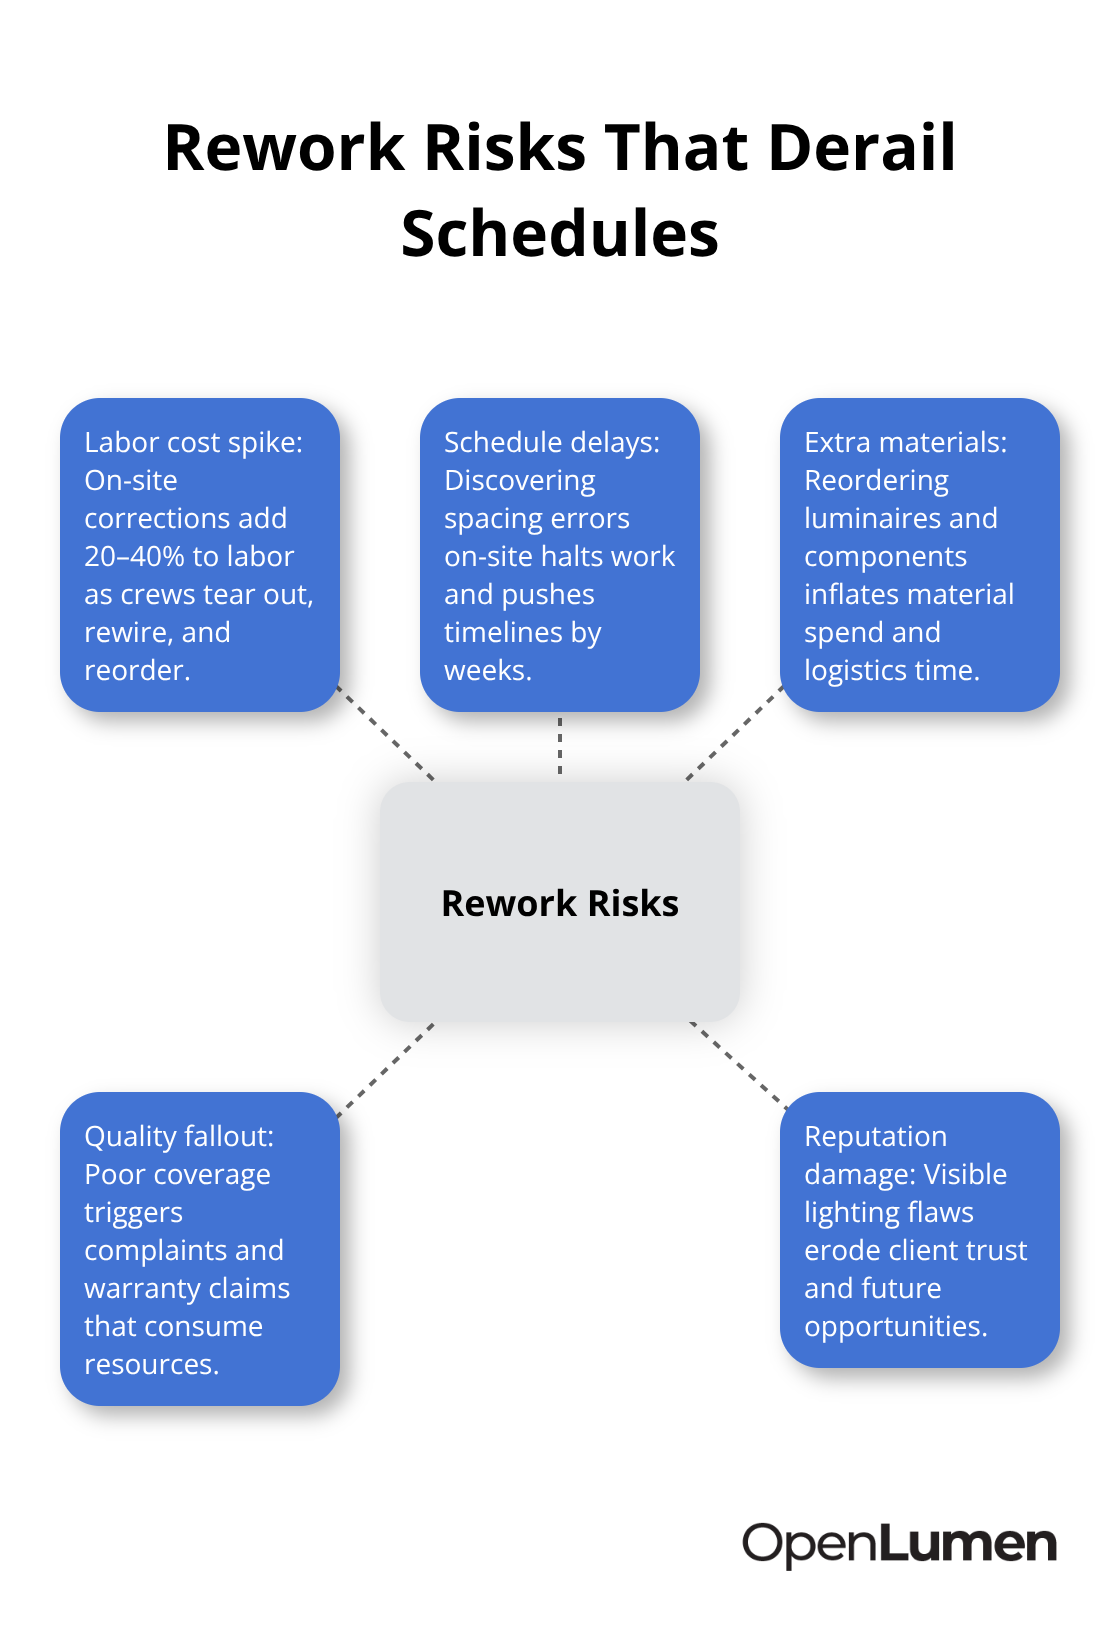
Inefficient lighting layouts drain budgets through energy waste, installation delays, and rework. Poorly spaced fixture plans create dark spots and overlaps that force contractors to add extra luminaires on-site, inflating material costs and labor hours. Studies show that well-lit areas reduce crime and improve public perception, yet many projects overshoot illuminance targets by 40 to 60 percent, wasting energy and creating light pollution. LEDs use up to 90 percent less energy than incandescent bulbs, but a bad layout negates this advantage-you still power fixtures you don’t need. Design errors caught after installation begins cost exponentially more to fix. A contractor who discovers spacing problems mid-project must halt work, source additional materials, rewire circuits, and reprogram controls. These delays push timelines by weeks and burn through contingency budgets. The real damage comes from designs that lack validation before fabrication: fixtures ordered to spec, trenches dug, electrical work completed-then you realize coverage is uneven or a zone falls short.
Spacing and Coverage Failures Hit Your Schedule Hard
Most projects fail because fixture spacing decisions lack photometric validation. Contractors estimate distances based on experience, assuming standard spacing works everywhere. It doesn’t. A 30-foot spacing works in a warehouse but creates dark corridors in a parking garage with different ceiling heights and reflectance. Without real-time analysis before installation, you discover the mistake when the crew is on-site. Rework means tearing out installed fixtures, rewiring, and reordering luminaires-adding 20 to 40 percent to labor costs. The alternative is accepting poor coverage, which leads to complaints, warranty claims, and reputation damage.
Professional lighting designers test layouts with photometric simulation before a single fixture ships. This approach catches spacing errors, validates zoning decisions, and confirms that each zone meets its illuminance target. A contractor who validates layouts upfront avoids costly site revisions and delivers projects on time.
Energy and Material Waste From Unoptimized Designs
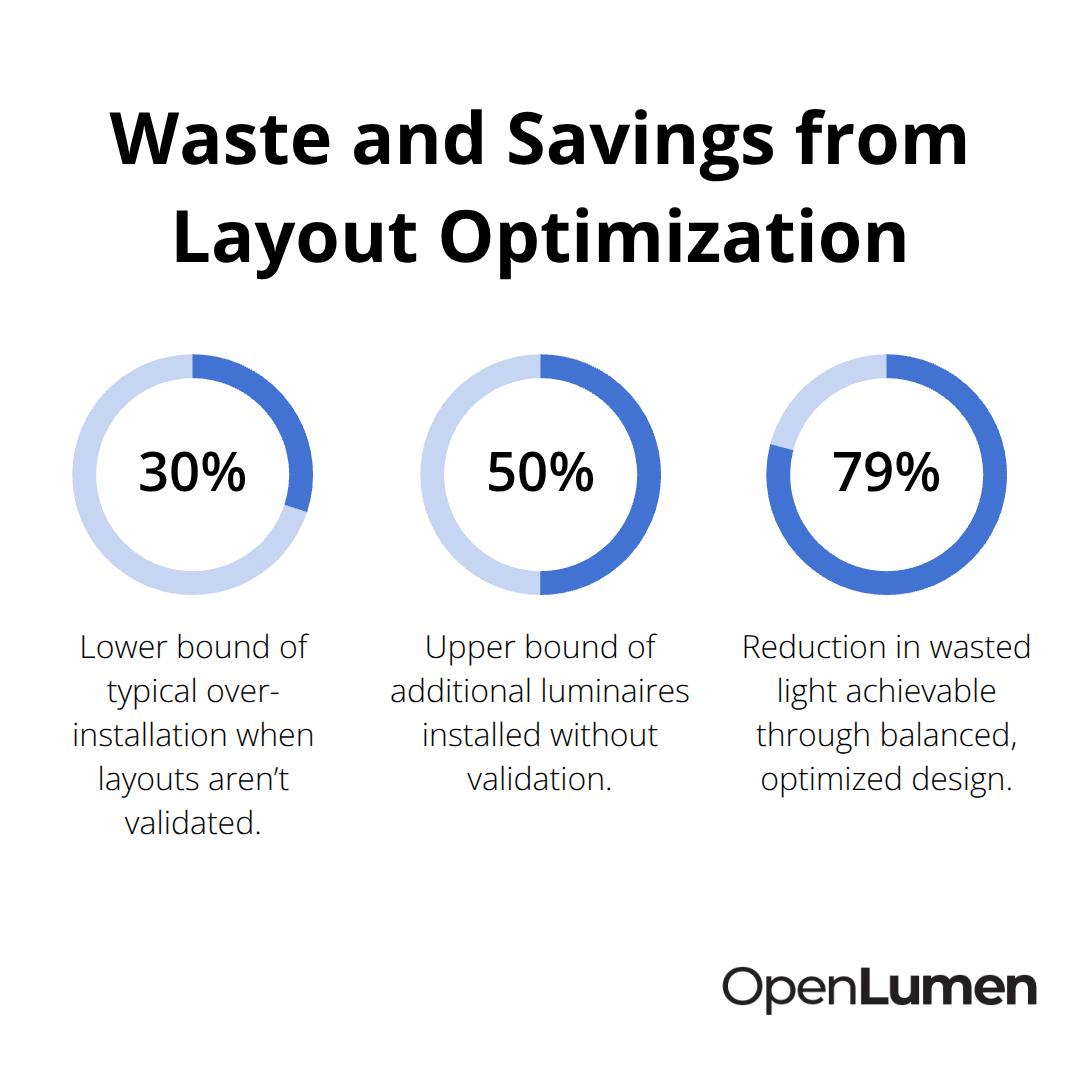
Unvalidated layouts typically install 30 to 50 percent more luminaires than necessary. Designers over-specify to guarantee coverage, but without photometric data, they can’t prove it works. Over-installation drives material costs, installation labor, and ongoing energy consumption. A 79 percent reduction in wasted light is achievable when designs balance coverage against installation cost using optimization methods that consider both objectives together.
This isn’t theoretical-it’s the outcome of rigorous photometric analysis applied to real urban lighting projects. Contractors and property owners who adopt validated layout design see measurable savings: fewer fixtures ordered, faster installation, lower energy bills.
How Real-Time Validation Changes the Outcome
The investment in proper design upfront eliminates rework, shortens schedules, and reduces waste across material and labor. Photometric validation before installation transforms how teams approach layout decisions. Instead of guessing at fixture placement, you test spacing, confirm illuminance targets, and adjust zoning based on actual light distribution data. This shift from assumption to evidence cuts installation surprises and keeps projects on budget. The next step is understanding which tools and workflows make this validation fast and accessible.
How to Build Layouts That Actually Meet Your Illuminance Targets
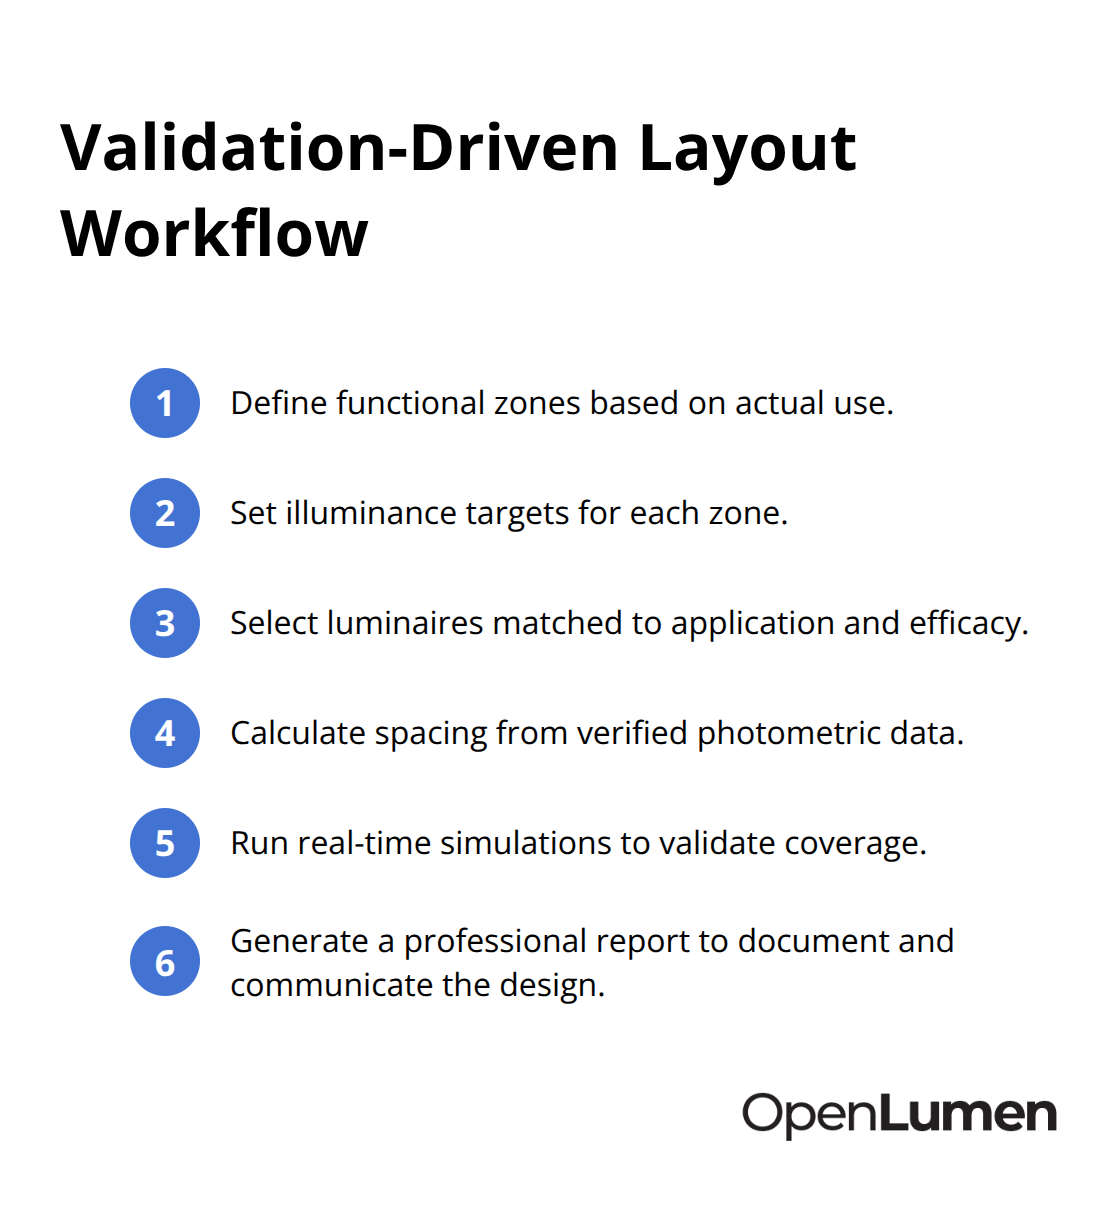
Efficient lighting layouts start with a single discipline: matching fixture placement to the specific illuminance your space requires. Most projects fail because designers treat all spaces the same. A parking garage needs 150 lux minimum in driving lanes but only 50 lux in circulation areas. An office desk task requires 300 lux, while a storage room functions at 100 lux. Without this clarity, you either over-light entire zones or leave critical areas dark. The illuminance requirement determines how many fixtures you need and where they must go.
Define Zones Based on How People Use Your Space
Start by mapping your space into functional zones based on actual usage patterns. High-traffic circulation routes demand consistent, adequate light. Work areas and task zones need concentrated illuminance. Low-activity storage or loading zones can operate at lower levels. This zoning approach cuts waste immediately because you stop lighting areas uniformly and start lighting them strategically. Qualitative zoning concentrates luminaires where they deliver the most value. End walls receive wallwashing to create depth and spatial impression, allowing you to lower ceiling brightness requirements elsewhere. Main circulation routes receive concentrated fixture placement to guide movement and ensure safety. Specific task areas like desks, equipment stations, or loading docks get targeted downlights. This layered approach uses fewer total fixtures than conventional grid-based layouts that light entire ceilings uniformly. Research from lighting design practice shows that qualitative layouts achieve the same perceived brightness with 30 to 40 percent fewer luminaires than traditional quantitative approaches.
Calculate Spacing From Photometric Data, Not Assumptions
Once zones are defined, spacing decisions follow directly from illuminance targets and fixture photometric data. A 400-watt high-intensity discharge luminaire with 30,000 lumens and a specific beam distribution covers different areas than a 150-watt LED with 12,000 lumens. Without photometric analysis, contractors guess at spacing. With it, you calculate exact distances that meet each zone’s requirement without overlap or gaps. Fixture spacing is not a standard distance applied everywhere. A 30-foot spacing appropriate for a warehouse with 20-foot ceilings creates dark corridors in a parking structure with 10-foot ceilings and different reflectance values. Spacing depends on ceiling height, beam angle of your selected luminaire, required illuminance, and the reflectance properties of walls and floor. Photometric simulation lets you test spacing before ordering fixtures. You input your space dimensions, select a luminaire from a verified library, place it at a proposed distance, and instantly see illuminance values across the floor or work plane. If spacing creates dark spots at 25 feet from the fixture, you tighten spacing to 20 feet and retest. This process takes minutes with proper tools and eliminates the guesswork that leads to on-site rework.
Choose Luminaires That Match Your Application
Selecting the right luminaire for your space type determines how efficiently spacing and zoning work. A narrow-beam spotlight concentrates light in a tight area-ideal for accent lighting or highlighting specific zones but wasteful for general area coverage. A wide-beam floodlight spreads light across a larger area but at lower intensity per point. A medium-beam luminaire balances spread and intensity for typical warehouse or parking applications. Luminaire efficiency-measured in lumens per watt-directly impacts energy consumption. An efficient LED luminaire delivering 150 lumens per watt costs less to operate than an older technology producing 80 lumens per watt at the same brightness. The color temperature of your luminaire affects perceived brightness and user comfort. A 4000K neutral white light feels brighter than 3000K warm white at the same illuminance level, so you might achieve adequate perception with fewer fixtures or lower power consumption by selecting the right color temperature for your application.
Access Photometric Data to Validate Coverage
Beam distribution data from the luminaire manufacturer-provided as polar charts and CIE files-determines how light spreads. This data is essential for photometric analysis. Without it, spacing calculations are estimates rather than validated results. The difference between guessing and calculating determines whether you install 50 fixtures or 35-a substantial cost difference that compounds over the fixture’s 25,000-hour lifespan when multiplied across energy consumption. When spacing is validated against actual photometric data, contractors know coverage is confirmed before installation begins. The cost of running simulations is negligible compared to the cost of discovering spacing errors after fixtures are ordered and installation starts. The energy savings extend beyond fixture count-lower overall illuminance means lower cooling loads from reduced heat emission, especially when using LED technology. Your zoning plan becomes the foundation for spacing decisions and luminaire selection. Without it, spacing calculations are meaningless because you have no target to validate against.
With zones defined, spacing calculated, and luminaires selected, you’re ready to move from theory to practice. The tools you choose determine how fast you validate layouts and how confident you feel before installation begins.
Tools That Validate Layouts Before Installation
Photometric simulation software transforms layout design from guesswork into verified planning. Without it, contractors space fixtures based on experience and hope coverage works. With it, you input your space dimensions, select a luminaire, place it at a proposed distance, and see exact illuminance values across your work plane in seconds. This shift from assumption to evidence eliminates the most expensive mistakes. A contractor who discovers spacing errors after fixtures are ordered and trenches are dug faces rework costs that dwarf the cost of running simulations upfront. The real-time analysis workflow catches problems when they’re cheap to fix-before any material ships or labor starts.
You test spacing at 25 feet, see dark spots appear, tighten spacing to 20 feet, retest, and confirm coverage meets your illuminance targets. This cycle repeats until your layout is validated. The alternative is installing 50 fixtures when 35 would work, then powering unnecessary luminaires for 25,000 hours across the fixture’s lifespan.
Photometric Data Determines Spacing Accuracy
Luminaire manufacturers provide photometric data as polar charts and CIE files that describe how light spreads in three dimensions. This data is non-negotiable for layout validation. Without it, spacing calculations are estimates. With it, spacing becomes a calculated result tied directly to your specific luminaire’s beam distribution, the ceiling height of your space, and the reflectance properties of walls and floor.
A 400-watt high-intensity discharge fixture with 30,000 lumens and a narrow beam angle covers different distances than a 150-watt LED with 12,000 lumens and a wide beam. Photometric simulation lets you test both and see which delivers adequate coverage with fewer fixtures. The Photometric Hub metrics-including polar charts, BUG ratings, and zonal lumens-provide the precise data needed to calculate exact spacing without guesswork.
When you compare luminaires side by side using verified photometric data, you spot efficiency differences immediately. An LED luminaire delivering 150 lumens per watt outperforms an older technology at 80 lumens per watt, cutting energy consumption and long-term operational costs. Community-verified luminaire libraries keep the cost of accessing this data minimal compared to the expense of installing fixtures that fail to meet coverage requirements.
Professional Reports Close Deals and Confirm Coverage
Contractors and distributors who generate professional illuminance reports before presenting layouts to clients gain a competitive advantage. The report shows exact coverage across your space, confirms that every zone meets its illuminance target, and lists the fixtures required. Clients see visual proof that the design works rather than accepting promises based on experience.
A report that displays illuminance contours, lists fixture specifications, and calculates total material and energy costs becomes a sales tool that closes deals faster. Property owners want confidence that coverage is validated before they approve budgets and sign contracts. A detailed report removes doubt and serves as installation documentation-the crew knows exactly where each fixture goes, what spacing was validated, and what illuminance each zone should deliver.
This clarity reduces on-site confusion and eliminates the need for contractors to make spacing decisions during installation. When installation follows a validated layout backed by professional documentation, projects complete on schedule and within budget. The time spent generating these reports upfront pays dividends in faster approvals, fewer installation surprises, and reduced rework.
Final Thoughts
Efficient lighting layouts design eliminates waste before it starts. When you validate spacing, confirm coverage, and optimize fixture placement before installation, you avoid the costly mistakes that derail projects. Poor layouts force contractors to add fixtures on-site, delay schedules, and inflate budgets, while validated layouts deliver fewer fixtures ordered, faster installation, lower energy consumption, and projects that stay on schedule.
The barrier to proper design has never been knowledge-it’s been access to the right tools. Professional photometric simulation software used to require expensive licenses and steep learning curves, but modern platforms now make layout validation fast and accessible to contractors, distributors, property owners, and designers at every experience level. You no longer need to guess at spacing or hope coverage works; you test layouts in real time, see exact illuminance values across your space, and generate professional reports that confirm your design before a single fixture ships.
Start your next project by defining zones based on actual usage patterns, calculating spacing from photometric data, and selecting luminaires matched to your application. Test your layout with real-time analysis before ordering materials, generate a professional report that documents your design and serves as installation guidance, and watch how validated design cuts waste and keeps projects on track. OpenLumen provides the tools to make this workflow standard practice through its free, browser-based platform that lets you access community-verified luminaire data, run instant photometric analysis, and generate professional reports without expensive software or technical barriers.
The information provided is for general educational purposes only and should not be considered professional engineering or lighting design advice. Always verify project requirements, local codes, and specifications with qualified professionals before making final decisions.