Photometric layout design separates confident projects from costly mistakes. Most contractors still rely on guesswork or outdated methods, leading to poor lighting performance and client dissatisfaction.
At OpenLumen, we’ve seen firsthand how verified photometric plans transform project outcomes. This guide shows you how to create layouts that work-backed by real data and professional documentation.
What Photometric Layout Design Actually Does
The Core Function of Photometric Plans
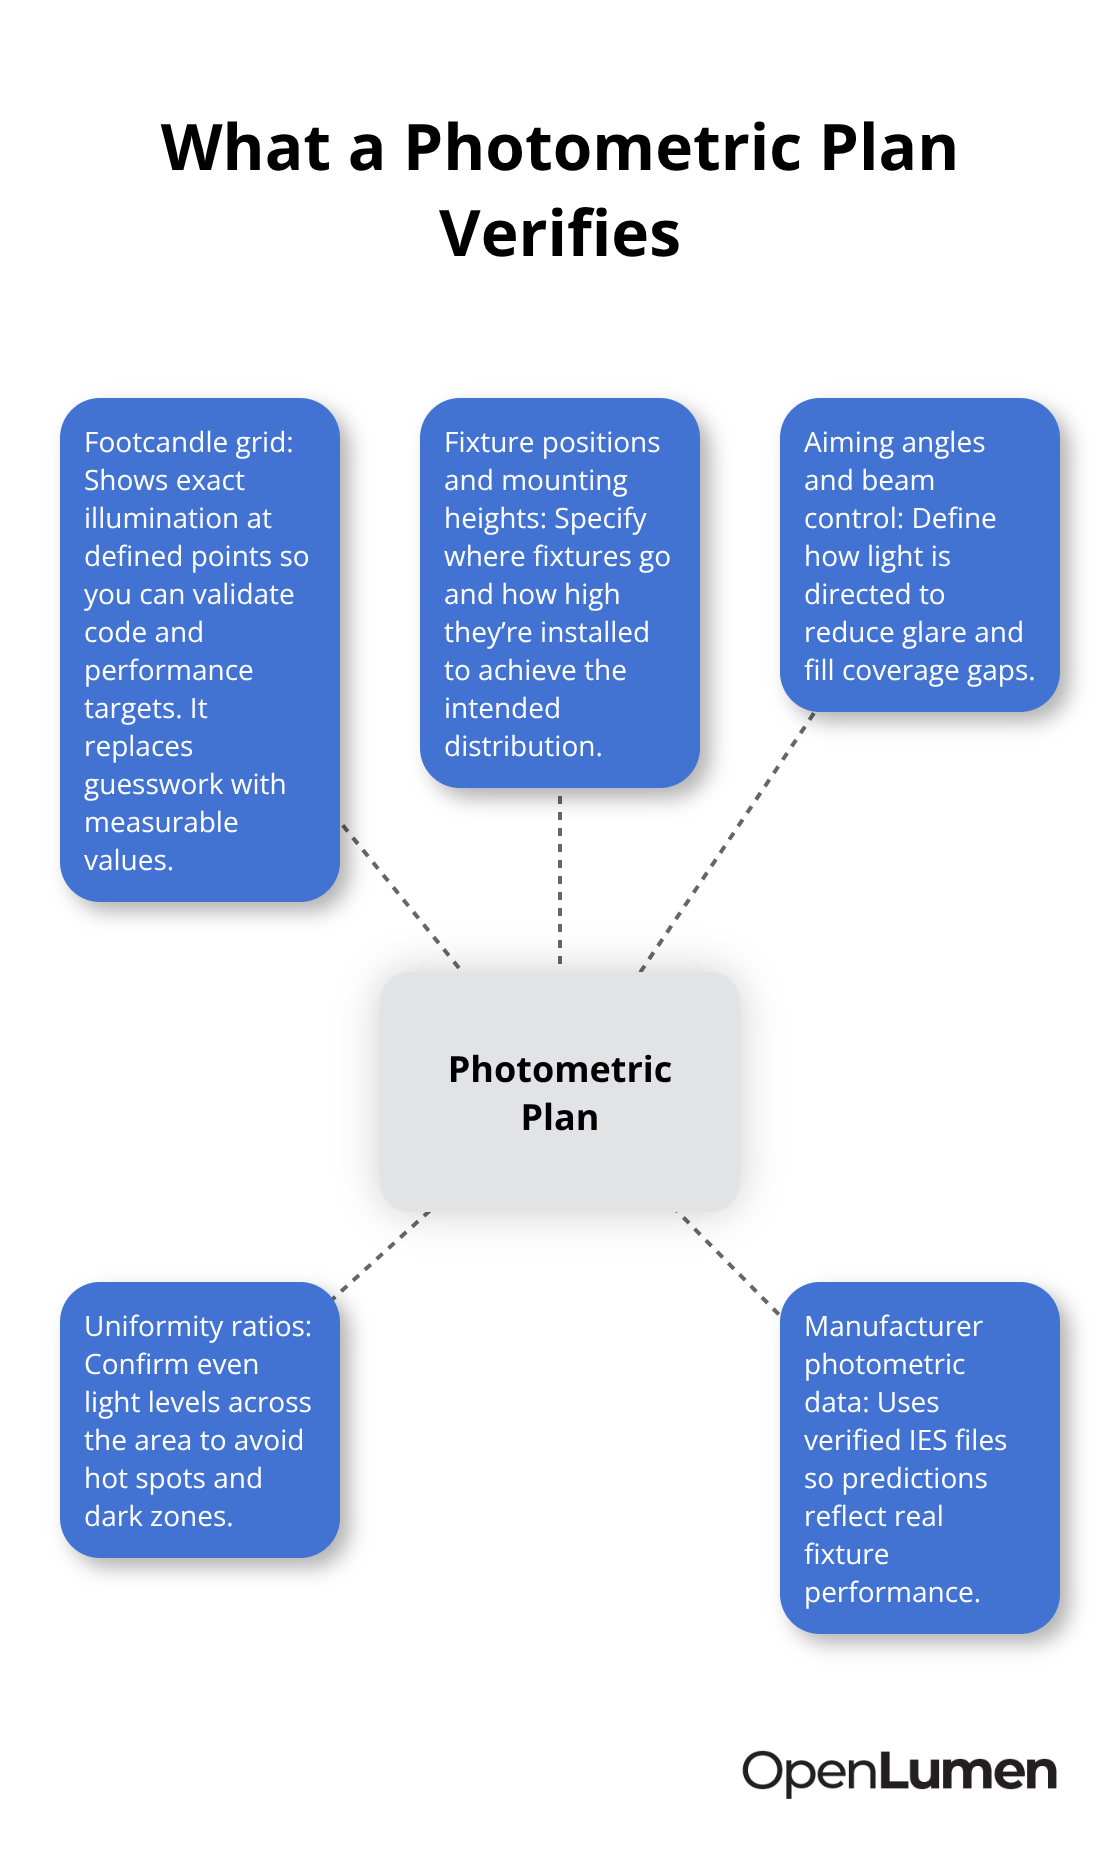
A photometric layout design is a software-generated plan that predicts exactly how light will distribute across a physical space before you buy or install a single fixture. It shows footcandle levels at specific points, fixture positions, mounting heights, aiming angles, and uniformity ratios-all backed by manufacturer photometric data. The core purpose is straightforward: verify that your lighting design will meet performance targets before installation begins. This eliminates the guesswork that has plagued lighting projects for decades.
When you design a warehouse, parking lot, sports facility, or retail space, a photometric plan tells you whether 40 fixtures at 16 feet mounting height will actually deliver the 30 footcandles you need across the floor, or whether dark zones will appear in certain areas. Without this verification, contractors install lighting, clients complain about poor performance, and change orders pile up.
Meeting Industry Standards with Confidence
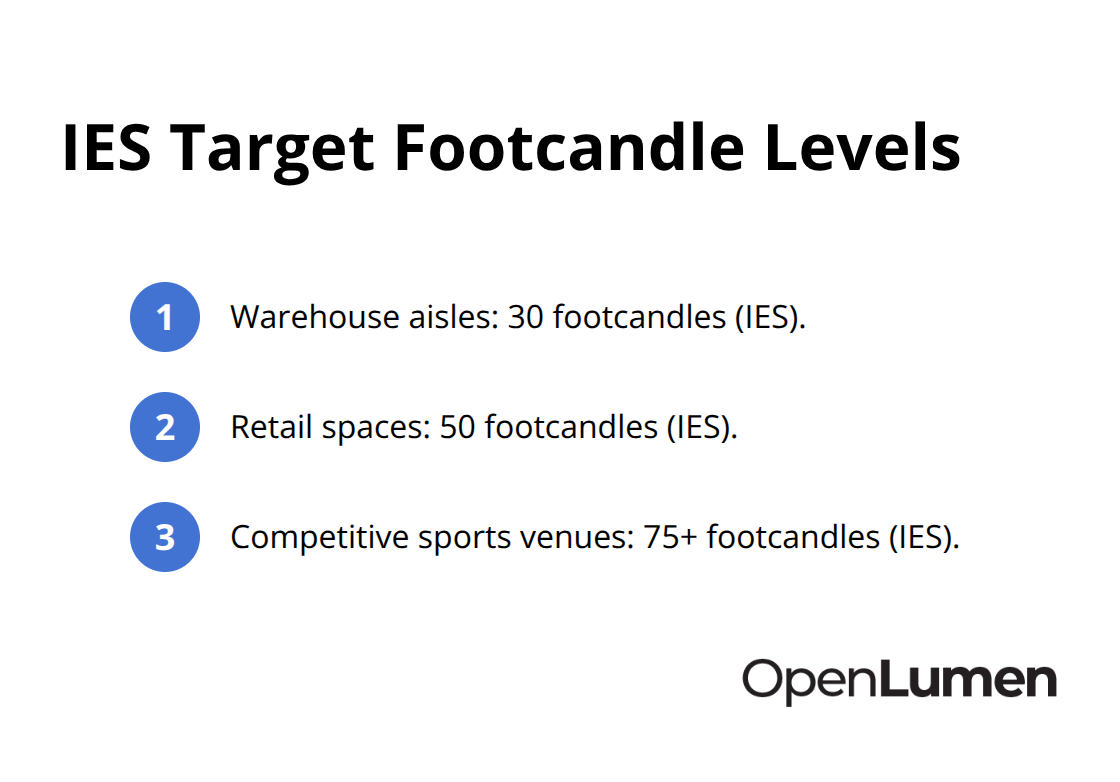
The IES (Illuminating Engineering Society) provides guidelines for target footcandle levels by application-30 footcandles for warehouse aisles, 50 for retail spaces, and 75 or higher for competitive sports venues. A photometric plan ensures you hit these targets consistently and document compliance for permit approvals and inspections.
Why Manual Methods Fall Short
Contractors and designers who skip photometric verification face real consequences. Manual calculations or rules of thumb fail because they don’t account for mounting height, beam angles, surface reflectance, and fixture placement interactions. A pole relocated by 10 feet can shift footcandle readings across an entire parking lot, affecting code compliance and safety.
Outdated methods also miss uniformity problems-areas where light levels spike or drop sharply, creating glare or dark zones that frustrate clients and trigger redesigns. Fixture schedules often mismatch actual installations, invalidating performance claims. Photometric plans prevent this by locking fixture specifications into the design before purchase.
The Real Cost of Skipping Verification
The typical cost for a third-party photometric study ranges from $500 to $2,000, but the real cost of getting it wrong-reinstalling fixtures, replacing poles, or dealing with permit rejections-runs far higher. Designers who use verified photometric layouts complete projects faster, reduce callbacks, and build client trust through documented proof that lighting will perform as promised. This foundation of verified data sets the stage for understanding how to actually create these plans.
Building Photometric Layouts That Actually Work
Lock Down Your Design Parameters First
Three concrete decisions must come before you touch any software: your target footcandle level, the exact space dimensions, and the mounting heights you’ll use. Target footcandles vary significantly by application-30 footcandles for warehouse aisles, 50 for retail spaces, and 75 or higher for competitive sports venues according to IES guidelines. Collect your space measurements, existing pole locations if this is a retrofit, photos of the area, and any special requirements like dark sky compliance or code-mandated uniformity ratios.
For most commercial spaces, try for a uniformity ratio of 4:1 or better (meaning the brightest point divided by the dimmest point equals 4 or less); sports facilities typically require 3:1 or better per NCAA and FIFA standards. The calculation grid spacing matters too-set it no greater than one-fifth of your mounting height to capture accurate light distribution.
Use Accurate Fixture Data to Drive Real Results
Once you have these inputs locked down, the software does the heavy lifting. Most modern photometric tools use manufacturer IES LM-63 files, which contain the exact light distribution data for each fixture model. Using the wrong IES file or an outdated version produces meaningless results-this step is non-negotiable.
The software simulates how light spreads from each fixture across your space, calculating footcandles at every grid point. Real-time illuminance analysis lets you swap fixtures, adjust mounting heights, or relocate poles and see the impact instantly. A warehouse layout that shows dark zones in the aisles can be fixed by adding one fixture or raising mounting height by 2 feet, all before you order anything.
Generate Reports That Prove Performance
The professional report you create becomes your proof of performance. A solid report includes the footcandle grid showing exact readings across the floor or lot, the uniformity ratio and average/minimum/maximum values, a fixture schedule listing catalog number, wattage, lumen output, beam angle, color temperature, and quantity, and visual representations like pseudo-color heat maps or 3D isometric views that make light distribution patterns obvious to clients and inspectors.
Light Loss Factor accounts for degradation over time; typical values range from 0.70 to 0.95 depending on the environment, so designs using LLF of 1.0 are overly optimistic about long-term performance. Document the exact LLF your design uses so clients understand what to expect after five years of operation.
Present Numbers That Matter to Stakeholders
When presenting to stakeholders, lead with the footcandle grid and uniformity numbers first-these answer the core question: will this design meet code and performance targets? Then show the fixture schedule to confirm pricing aligns with the design. Heat maps and 3D visualizations build client confidence but remain secondary to the numbers.
One critical step many skip: verify that the study reflects real-world conditions. Mounting heights shown in the report must match what will actually be installed; a study valid at 16 feet delivers wrong results if poles end up at 18 feet. Surface reflectance matters too-concrete reflects differently than asphalt, and walls with paint reflect differently than bare brick, so note these details in your project file.
With your verified layout locked in and your stakeholders confident in the numbers, the next step focuses on how to communicate these designs to your team and move from plan to installation without surprises.
How to Build Reports That Clients Actually Trust
The Three Core Elements Clients Demand
A professional photometric report needs three core elements to stand on its own: the footcandle grid showing exact light levels across the space, the uniformity ratio with average, minimum, and maximum values, and the fixture schedule listing catalog number, wattage, lumen output, beam angle, color temperature, and exact quantity. Without these three, your report is incomplete and clients will question whether the design actually works. The footcandle grid proves that light levels meet code requirements.
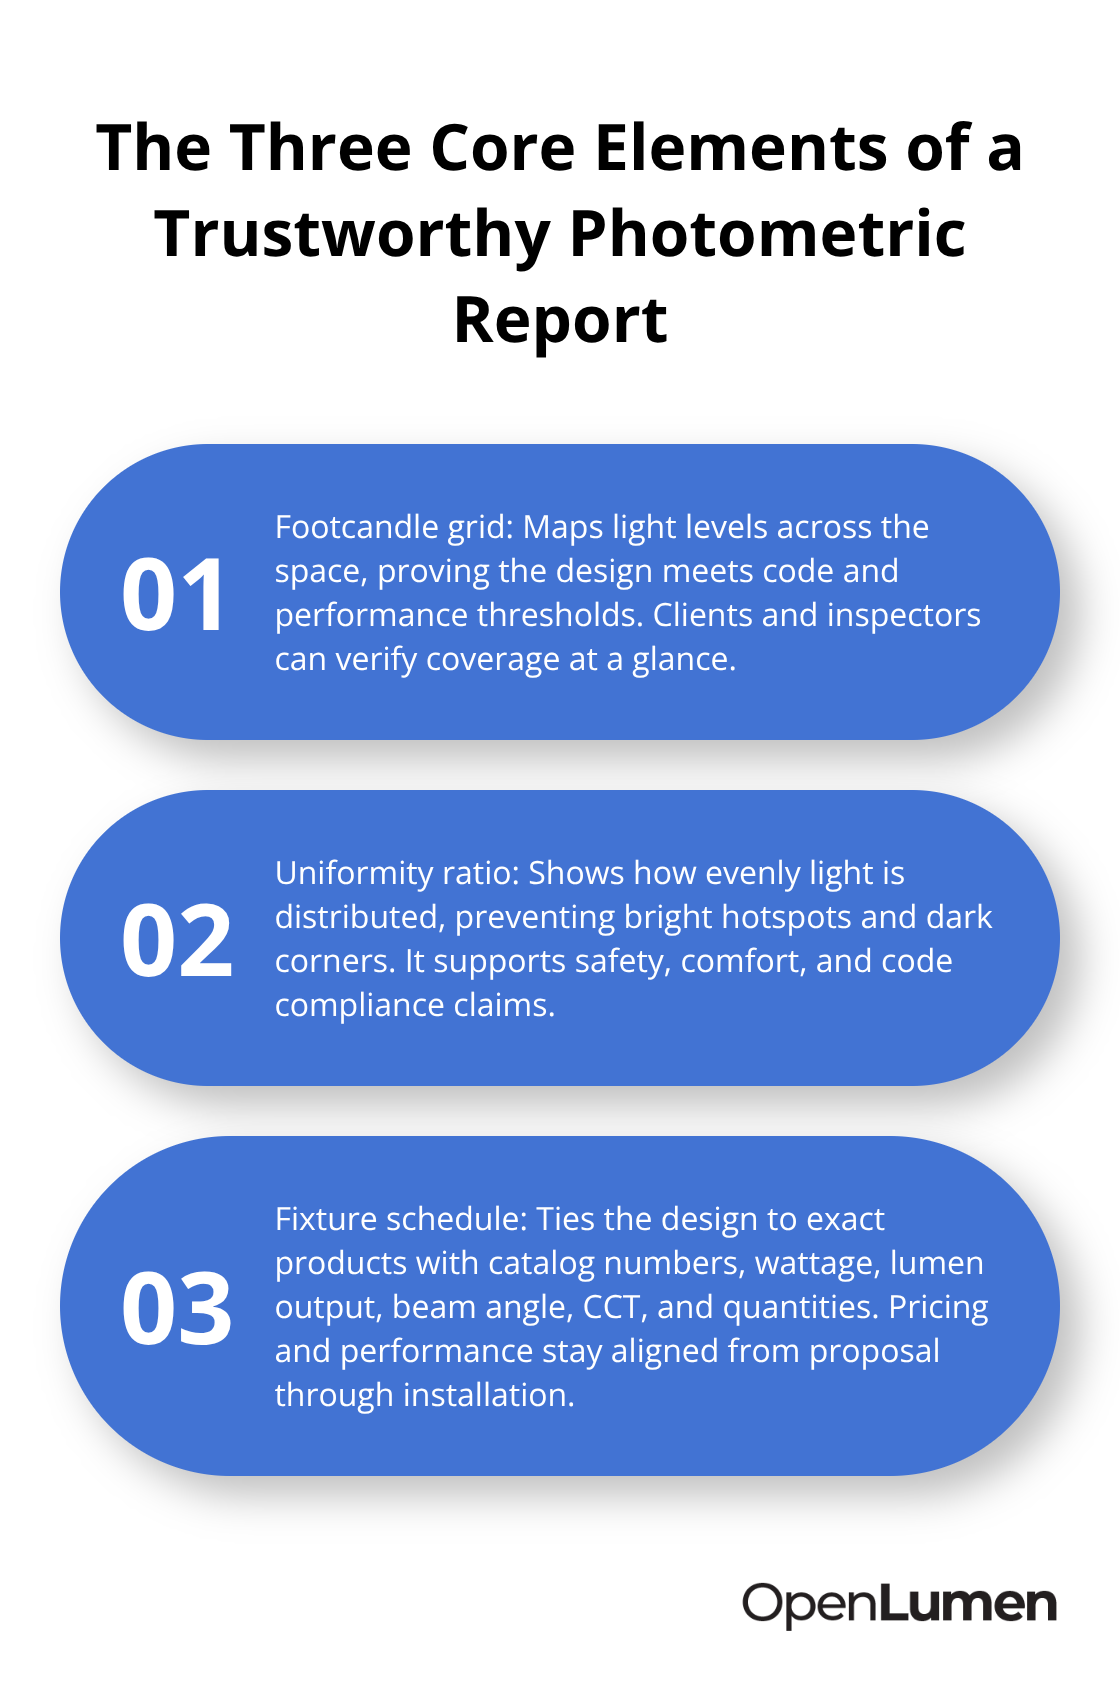
The uniformity ratio prevents complaints about dark corners or bright hotspots. The fixture schedule locks the design to specific products so pricing matches performance claims.
Visual Proof Closes Deals Faster
Most contractors stop at numbers and wonder why clients hesitate to approve projects. The missing piece is visual confirmation. Pseudo-color heat maps translate footcandle numbers into colors that clients instantly understand-red zones show bright areas, blue zones show dim areas, and everything in between tells the story of whether your design delivers even light or creates problem zones. A 3D isometric view renders light intensity as height, making uniformity issues visually obvious without requiring clients to read a grid of numbers. When you present both the numbers and the visuals together, objections disappear because clients see proof, not promises.
Document Light Loss Factor for Realistic Long-Term Performance
One critical detail most reports miss: document the Light Loss Factor you used in your calculations. Typical values range from 0.70 to 0.95 depending on environment and maintenance frequency. A design using LLF of 1.0 claims perfect long-term performance, which isn’t realistic. Using LLF of 0.80 or 0.85 shows clients you’ve accounted for fixture aging, dust accumulation, and reduced lumen output over five years-this transparency builds trust.
Specify Installation Details to Prevent Field Changes
Include the exact mounting heights, aiming angles, and pole locations in your report so the installation team has no room for interpretation. A pole moved 10 feet from the design location shifts footcandles across the entire space and breaks your uniformity claims. When presenting to stakeholders, lead with the footcandle grid and uniformity numbers first-these answer whether code compliance is achieved. Then show the fixture schedule to confirm pricing aligns with the design. Heat maps and 3D views reinforce confidence but rank second to the performance data.
Address Dark Sky and Boundary Compliance for Outdoor Projects
For outdoor projects, add dark sky compliance information if local codes require it; show boundary footcandles and confirm they stay within municipal thresholds, often around 0.1 footcandles or lower. This detail prevents permit rejections after installation and demonstrates that your design respects neighborhood lighting standards.
Final Thoughts
Photometric layout design stops being optional the moment you realize that guesswork costs more than verification. The contractors and designers winning projects today possess documented proof that lighting will perform as promised, not intuition or assumptions. Digital tools have eliminated the friction that once made photometric planning expensive and slow-what used to require specialized software costing thousands and expertise that took years to develop is now accessible to contractors and designers at every level. Real-time illuminance analysis lets you swap a fixture or adjust mounting height and see the impact in seconds, while professional reports generate automatically with heat maps and 3D visualizations that build stakeholder confidence faster than spreadsheets ever could.
The result is measurable: fewer callbacks, faster approvals, higher client satisfaction, and projects that perform exactly as designed. When you move from design to installation with a verified photometric plan in hand, surprises disappear because permit inspectors see documented compliance and clients see proof that their investment delivers the lighting performance they paid for. Platforms like OpenLumen make this workflow accessible without expensive software or steep learning curves-you design, validate, and generate professional reports in a browser using community-verified fixture data and instant photometric metrics.
Start with your next project by gathering your space dimensions, target footcandles, and mounting heights. Run a photometric layout design, test different fixtures or pole locations, and generate your report for stakeholder presentation. Then install with confidence, knowing exactly what your lighting will deliver.
The information provided is for general educational purposes only and should not be considered professional engineering or lighting design advice. Always verify project requirements, local codes, and specifications with qualified professionals before making final decisions.