Retail lighting layouts directly influence how customers shop and how much they spend. Poor lighting costs you sales, wastes energy, and damages your brand image.
We at OpenLumen know that most retailers either over-light their spaces, wasting thousands annually, or under-light key areas, losing conversions. This guide shows you how to design lighting that sells.
Why Lighting Design Directly Impacts Your Bottom Line
Sales Growth Through Strategic Lighting
Lighting shapes customer behavior in ways most retailers underestimate. When customers see products clearly under the right color temperature and brightness, they spend more. ENERGY STAR data shows that converting to LED lighting in U.S. grocers increased sales by approximately 19 percent. A German retail study found even stronger results: LED-lit areas drove a 6 percent sales increase and 15 percent regional traffic boost over 21 weeks.
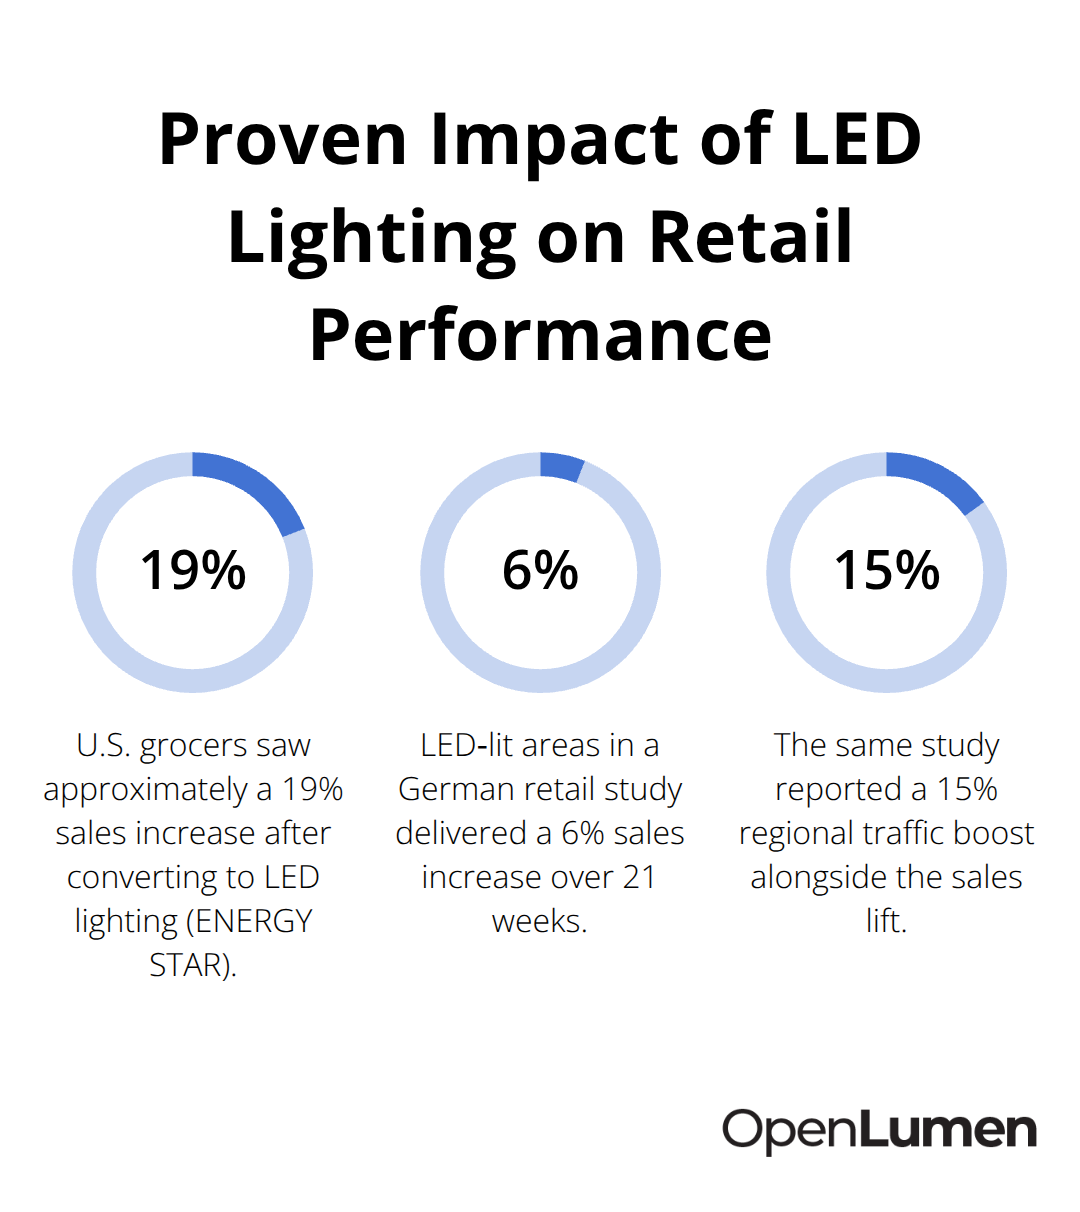
These aren’t marginal gains-they’re the difference between a thriving store and one struggling to move inventory.
The mechanics are straightforward: proper lighting reveals product texture, color, and quality. Poor lighting hides these details, making customers doubt what they’re buying. Dressing rooms illustrate this perfectly. Flattering indirect lighting can increase purchase likelihood from roughly 10 percent to 67 percent because customers actually see how clothes look on them. Overhead or fluorescent fixtures do the opposite, casting unflattering shadows that kill conversions.
Lighting also controls where customers look and how long they stay in each zone. Your eyes naturally follow brightness and contrast. A well-lit display draws attention; a dark corner gets ignored. This isn’t psychology-it’s neurology. Humans are phototropic, meaning light directs eye movement and attention automatically.
Energy Efficiency and Operating Costs
Energy efficiency and operating costs matter just as much as sales impact. Over-lit retail spaces waste thousands annually on unnecessary electricity and maintenance. LEDs last roughly 50,000 hours compared to traditional fixtures, which cuts replacement labor and downtime significantly. Smart LED systems reduce energy consumption by up to 50 percent versus manually controlled lighting because you’re not running full brightness during slow periods or natural daylight hours.
Brand Perception Through Lighting Atmosphere
Brand perception ties directly to lighting atmosphere. A luxury apparel store needs warm, directional accent lighting at 3000–3500K to feel high-end. A hardware store needs cooler, brighter lighting at 4000–5000K to convey clarity and precision. Mismatched lighting damages trust. If your lighting feels cheap or inconsistent, customers assume your products are too.
Color rendering index matters here: try for 90+ CRI to display true product colors. Inconsistent or poor CRI makes colors look washed out or muddy, eroding perceived value.
The Strategic Approach to Retail Lighting
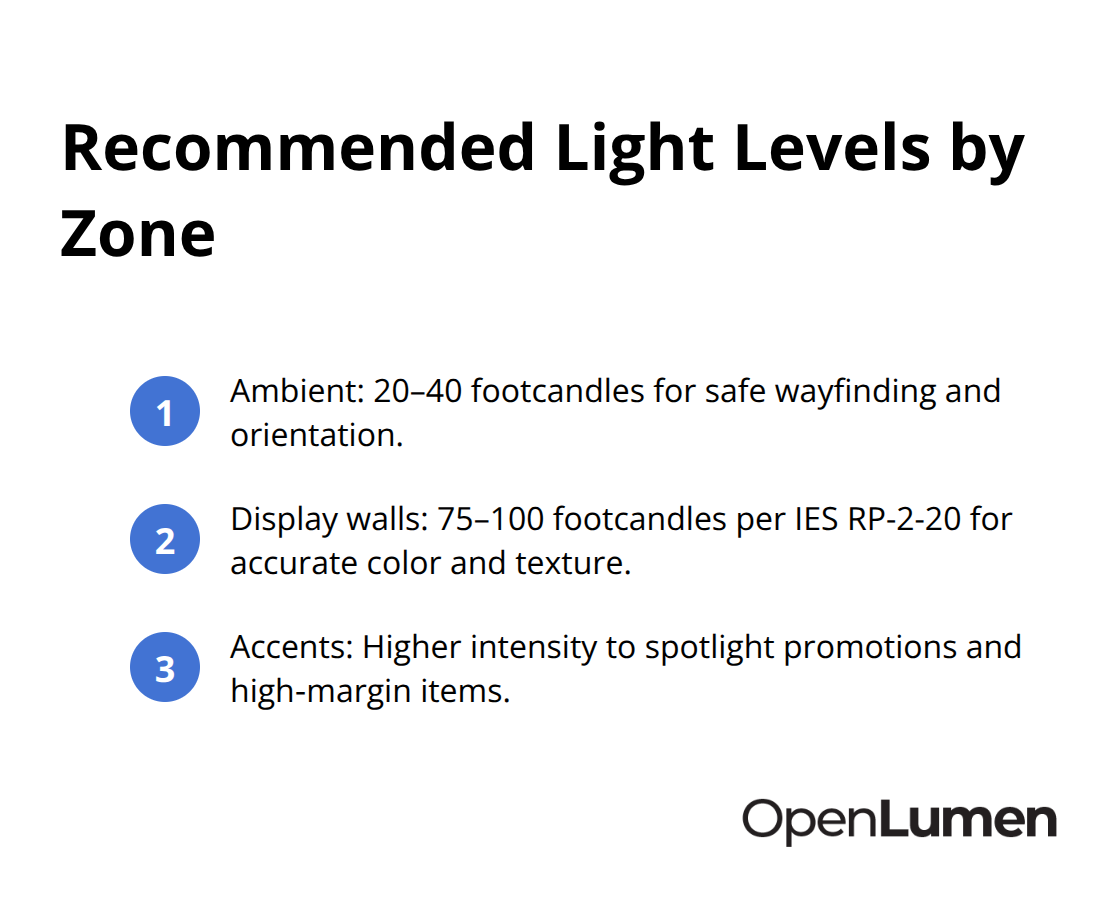
The practical reality is that most retailers design lighting reactively-they install whatever fixtures fit the budget-rather than strategically. Effective layouts require zoning: different areas need different light levels and temperatures. Ambient lighting provides general wayfinding at 20–40 footcandles on the floor. Display walls need 75–100 footcandles to make products pop. Accent lighting highlights promotions and key merchandise at higher intensity. Task lighting supports checkout and fitting rooms with directional, flattering sources.
Layering these three types creates an inviting space that guides customers through a clear shopping journey while avoiding sensory overload or visual chaos from mismatched fixtures and brightness levels. The next section shows you exactly how to zone different retail areas and balance these lighting layers to maximize both sales and efficiency.
Building Layouts That Light Products, Not Just Spaces
Assign Light Levels to Match Function, Not Budget
Different retail zones demand different light levels and color temperatures, yet most retailers install uniform fixtures throughout and wonder why certain areas feel dead while others cause eye strain. Ambient lighting at 20–40 footcandles on the floor provides wayfinding and general visibility-enough for customers to move safely and orient themselves. Display walls and product shelves require 75–100 footcandles according to the Illuminating Engineering Society standard RP-2-20 because customers need to see texture, color accuracy, and quality details that drive purchase decisions. Accent lighting at higher intensity spotlights promotions, new arrivals, and high-margin items, creating visual hierarchy that pulls attention without overwhelming the space.
The mistake retailers make is treating all areas equally: they either blast everything at 50+ footcandles, wasting 30–40 percent of energy on areas that don’t need it, or they skimp everywhere and lose sales in critical zones. Grocery stores that converted half their space to LED while keeping the fluorescent half found a 2 percent sales increase in the LED section over identical merchandise in dim areas. That gap widens dramatically in dressing rooms and feature displays where lighting directly influences purchase intent.
Match Color Temperature and CRI to Build Trust
Color temperature and color rendering index work together to either build or destroy brand trust within these zones. Most retail spaces use 3000–3500K for warmth and approachability, but this temperature only works if your fixtures deliver 90+ CRI-without high color rendering, warm light just makes products look dull and muddy. Dressing rooms need 4000–4500K with directional, diffused front lighting that flatters skin tone and fabric colors; overhead or fluorescent fixtures in dressing rooms are conversion killers because they cast shadows that make customers look worse than they do in natural light.
Produce, bakery, and deli sections benefit from cooler 4000–5000K lighting that emphasizes freshness and cleanliness, but only if you avoid glare on wet surfaces and glass cases. Angle fixtures toward products rather than toward customers’ eyes to eliminate reflections that obscure merchandise.
Test and Validate Before Full Installation
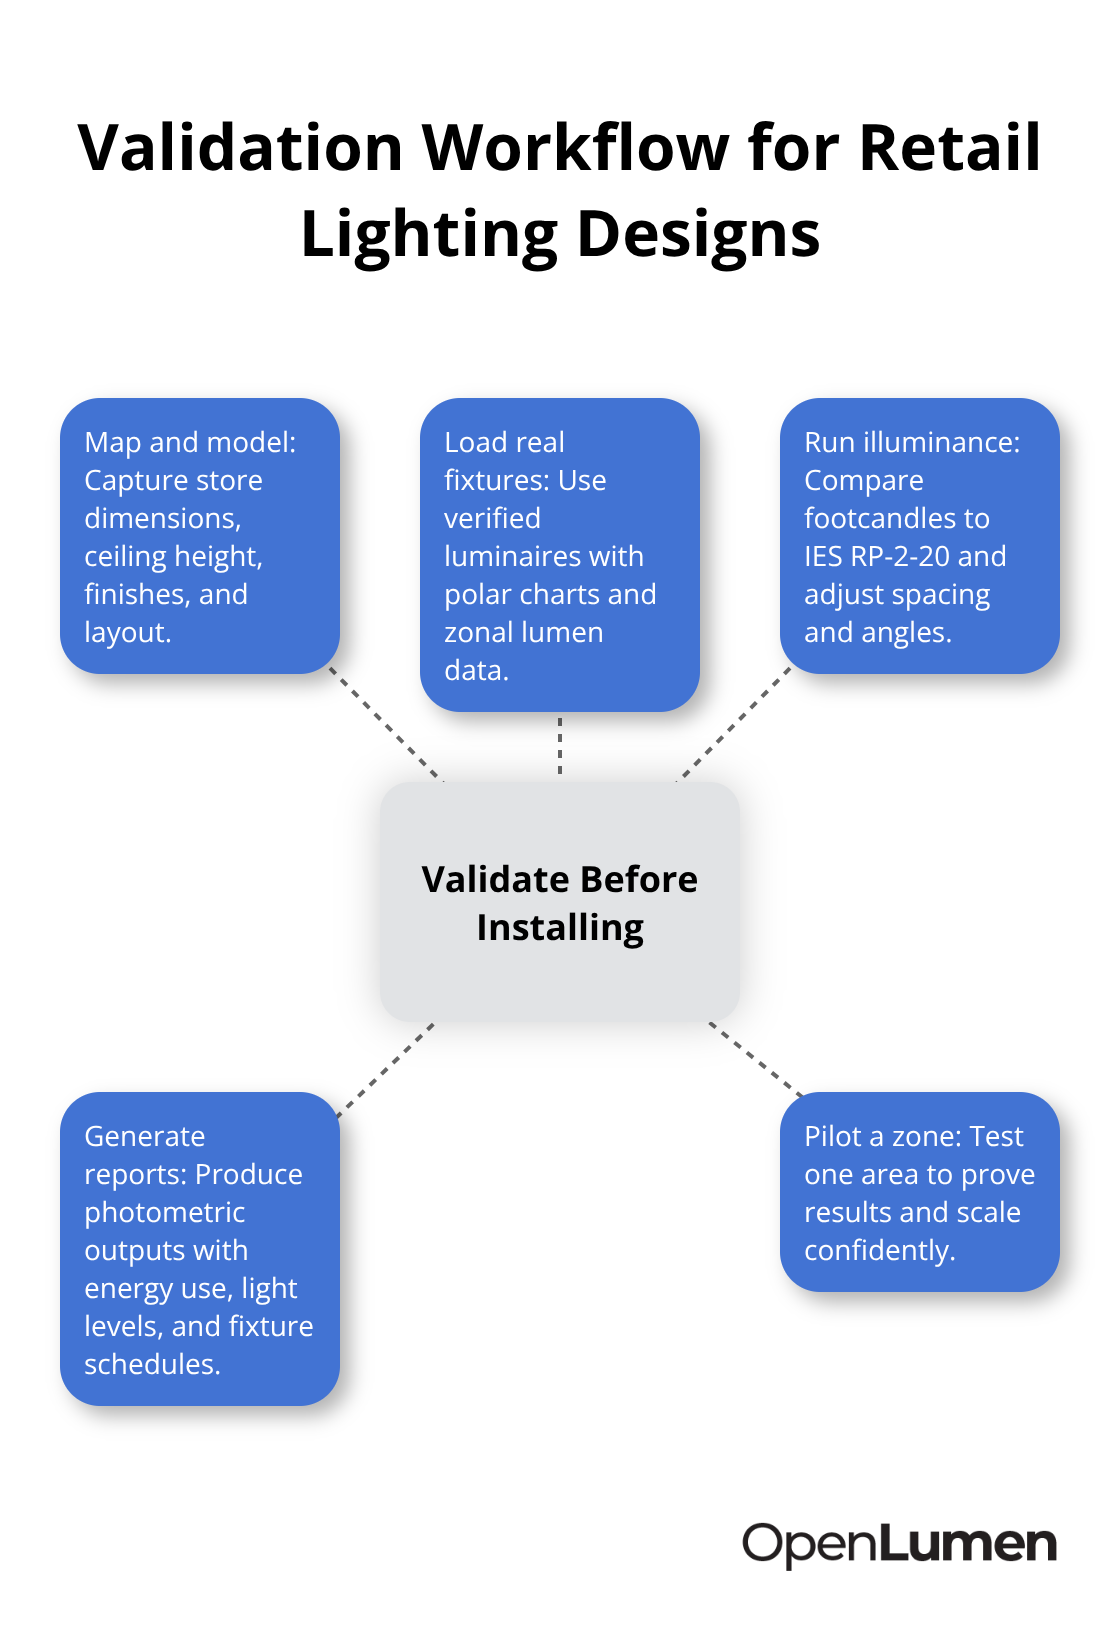
Map your store into zones-aisles, wall displays, produce, fitting rooms, checkout-then assign footcandle targets and color temperatures to each based on function and merchandise type, not budget convenience. Test one zone with new lighting before rolling out the entire store; measure actual illuminance levels with a light meter or photometric software to confirm you hit targets rather than guessing. This validation step prevents the costly mistake of installing fixtures that look good on spec sheets but perform poorly in your actual space with your ceiling height, paint finish, and merchandise placement.
The data you collect during testing becomes your baseline for the rest of the store. Once you validate that your chosen fixtures and layout deliver the sales lift and energy savings you expect in one zone, you can confidently scale that approach across other areas. This methodical approach transforms lighting from a guessing game into a measurable investment-one where you know exactly what results to expect before you commit budget to the entire space.
Validating Your Lighting Design Before Installation
Guessing whether your lighting layout will work costs money. Testing reveals problems before you purchase fixtures, install them, and discover the space feels too dark or the energy bill exceeds expectations. Photometric analysis eliminates guesswork by measuring illuminance levels across your floor plan, showing you footcandle values in every zone and identifying dark spots or over-lit areas before installation. Real-time analysis tools let you adjust fixture placement, swap luminaires, or change color temperatures instantly and see results on screen rather than waiting weeks for a theoretical report. Professional reports generated from validated designs give your stakeholders concrete data about energy savings, light levels, and expected performance-not promises, but measurements tied to actual products and placement.
Map Your Space and Load Real Fixture Data
Start by mapping your store dimensions, ceiling height, paint colors, and merchandise layout into your design tool. Add fixtures from a verified luminaires library that includes polar charts and zonal lumen data so calculations reflect real product performance rather than theoretical estimates. This foundation ensures your analysis matches what actually happens when you install the fixtures in your specific space.
Run Illuminance Analysis Against Standards
Run illuminance analysis across your floor plan and compare results against IES RP-2-20 standards: 20–40 footcandles on aisles, 75–100 footcandles on product walls, higher intensity for accent lighting. Adjust fixture spacing, angles, and types until your analysis shows you hit targets in every zone without over-lighting. The screen-based adjustments cost nothing; field changes cost thousands.
Generate Reports That Prove Performance
Generate a photometric report that documents footcandle values, energy consumption, and fixture schedules-this becomes your installation blueprint and your proof to stakeholders that the design works. The report transforms lighting from a budget decision into a confidence decision: you know what you’re getting because you’ve measured it.
Test One Zone Before Store-Wide Rollout
When you test one zone first before rolling out store-wide, use the same validated layout and fixtures so results scale predictably. This methodical approach catches problems on screen where fixes cost nothing, not in the field where changes mean rework and delays. Validation eliminates the expensive mistake of installing fixtures that look good on spec sheets but perform poorly in your actual space with your ceiling height, paint finish, and merchandise placement.
Conclusion
Retail lighting layouts succeed when you treat them as a measurable investment, not a budget line item. The three principles that drive results are straightforward: assign light levels to match function, validate designs before installation, and scale what works. A grocery store that converts to LED in one section and measures a 2 percent sales lift knows exactly what to expect when rolling out the rest of the store.
Your next step is to map your store zones, assign footcandle targets based on function, and test one area before committing to full installation. Use photometric analysis to validate your fixture choices and placement against IES RP-2-20 standards rather than installing and hoping. This approach catches problems on screen where fixes cost nothing, not in the field where changes mean rework and delays.
You can map your space, load real fixture data from a community-verified luminaires library, run instant illuminance analysis, and generate professional reports-all in your browser without expensive software or technical expertise. Start your first retail lighting layout at OpenLumen and see how validation transforms lighting from guesswork into measurable results.
The information provided is for general educational purposes only and should not be considered professional engineering or lighting design advice. Always verify project requirements, local codes, and specifications with qualified professionals before making final decisions.