A photometric report is often the difference between winning a project and losing it to a competitor. At OpenLumen, we’ve seen countless lighting designs fail to convert because the proposal didn’t clearly communicate value to the client.
Professional photometric reports do more than show calculations-they tell a story about energy savings, coverage quality, and return on investment. When you present data the right way, clients understand why your design is the best choice.
What Makes a Professional Photometric Report
Accuracy You Can Defend
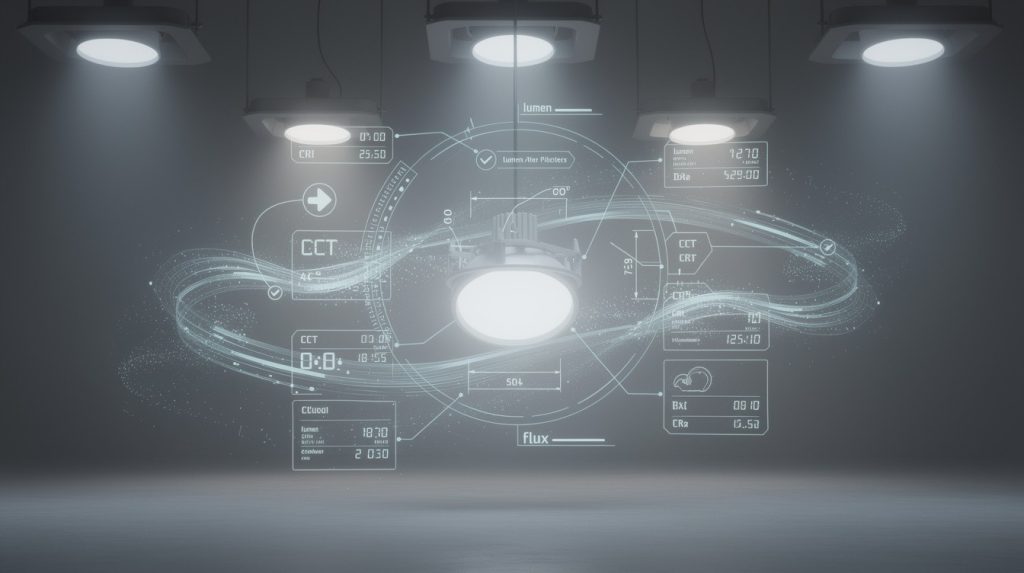
The difference between a report that closes deals and one that sits in a client’s inbox comes down to three things: accuracy you can defend, compliance that satisfies building departments, and visuals that make sense at a glance. A professional photometric report uses manufacturer IES LM-63 data files for the exact fixture model you’re quoting, not generic approximations or outdated files. This matters because LED optics distribute light differently than older HID technology, and a watt-for-watt comparison without photometric verification often delivers under-lit or over-lit spaces. When you load the correct IES file into photometric software like DIALux Evo or AGi32, the simulation matches real-world performance, giving you credibility with architects, engineers, and code officials.
Accuracy also means calculating footcandles at enough grid points to catch dark spots-sparse grids hide problems. A professional report includes at least 50 to 100 calculation points across the illuminated area, with results showing average, minimum, and maximum footcandles so clients see uniformity, not just peak brightness.
Meeting Code and Standards
Compliance matters because municipalities, sports bodies, and facility owners rely on photometric reports to prove a design meets code. The IES Lighting Handbook sets footcandle targets by space type: parking lots range from 1 to 5 footcandles depending on lot type, offices need 30 to 50 footcandles at task areas, and sports facilities like basketball courts require 50 to 100 footcandles with uniformity ratios of 3:1 or better to meet NCAA standards. AASHTO roadway guidelines, OSHA warehouse standards, and local dark sky ordinances all appear in a credible report.
Your report must cite which standard applies and show that your fixture layout and mounting heights achieve those targets. Code officials expect this documentation before they approve permits, so skipping compliance details costs you projects.
Visuals That Persuade
The visual side is where most proposals lose ground. A footcandle grid alone means nothing to someone without a lighting background; you need isolux contour lines showing where light falls off, a fixture layout diagram with exact pole positions and mounting heights, and a luminaire schedule that lists catalog numbers, wattage, lumen output, NEMA beam angles, color temperature, and fixture count.
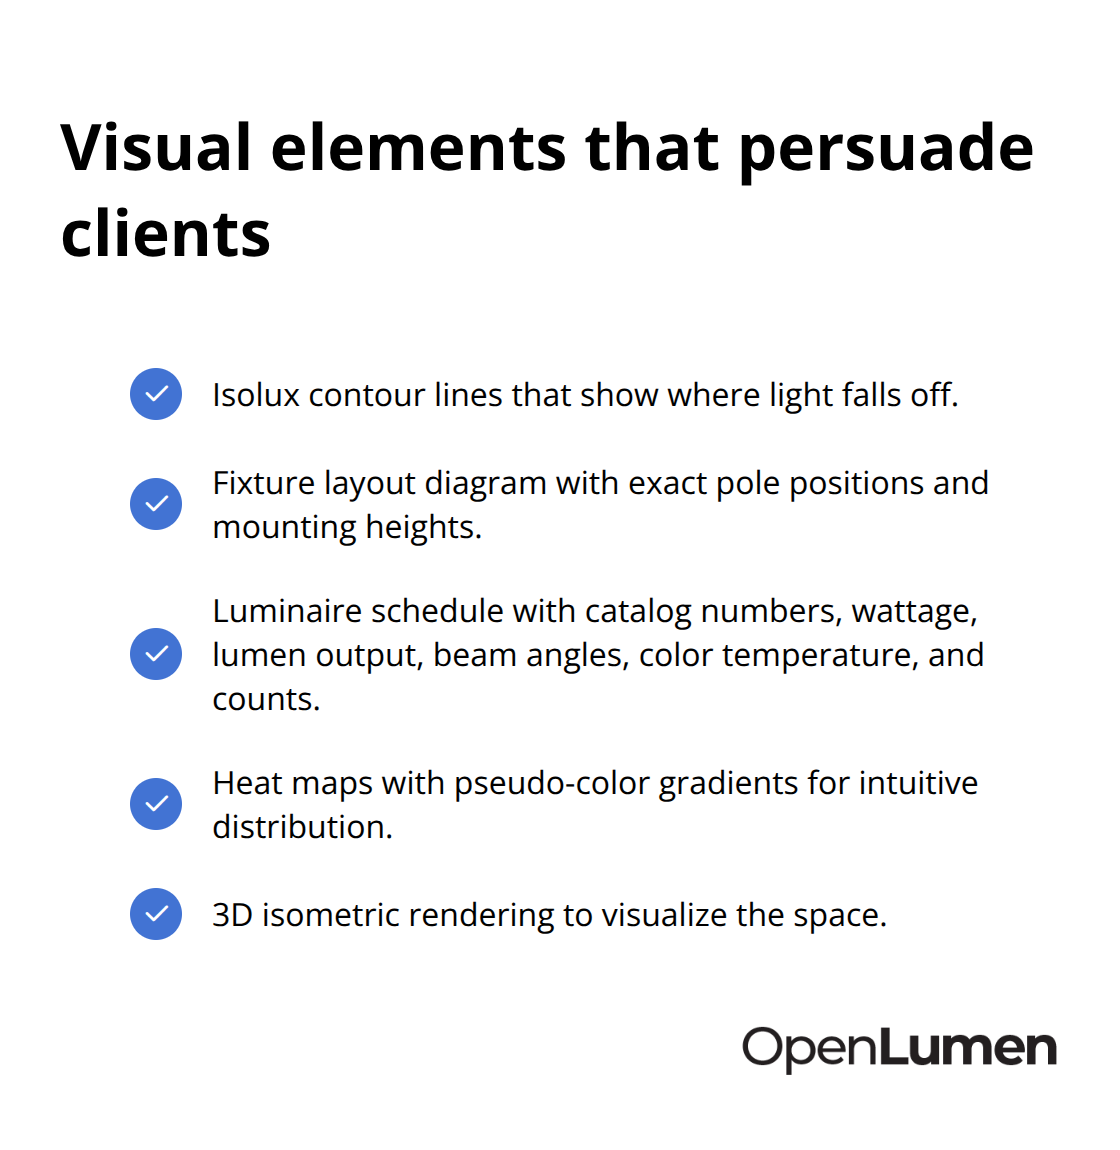
Heat maps using pseudo-color gradients make light distribution intuitive, and a 3D isometric rendering shows clients how the space actually looks. Without these visuals (even accurate calculations fail to persuade), your proposal competes on price rather than value. The next section shows how to leverage these elements to build proposals that actually convert prospects into customers.
Building Photometric Reports That Close Deals
Lead with Business Outcomes, Not Calculations
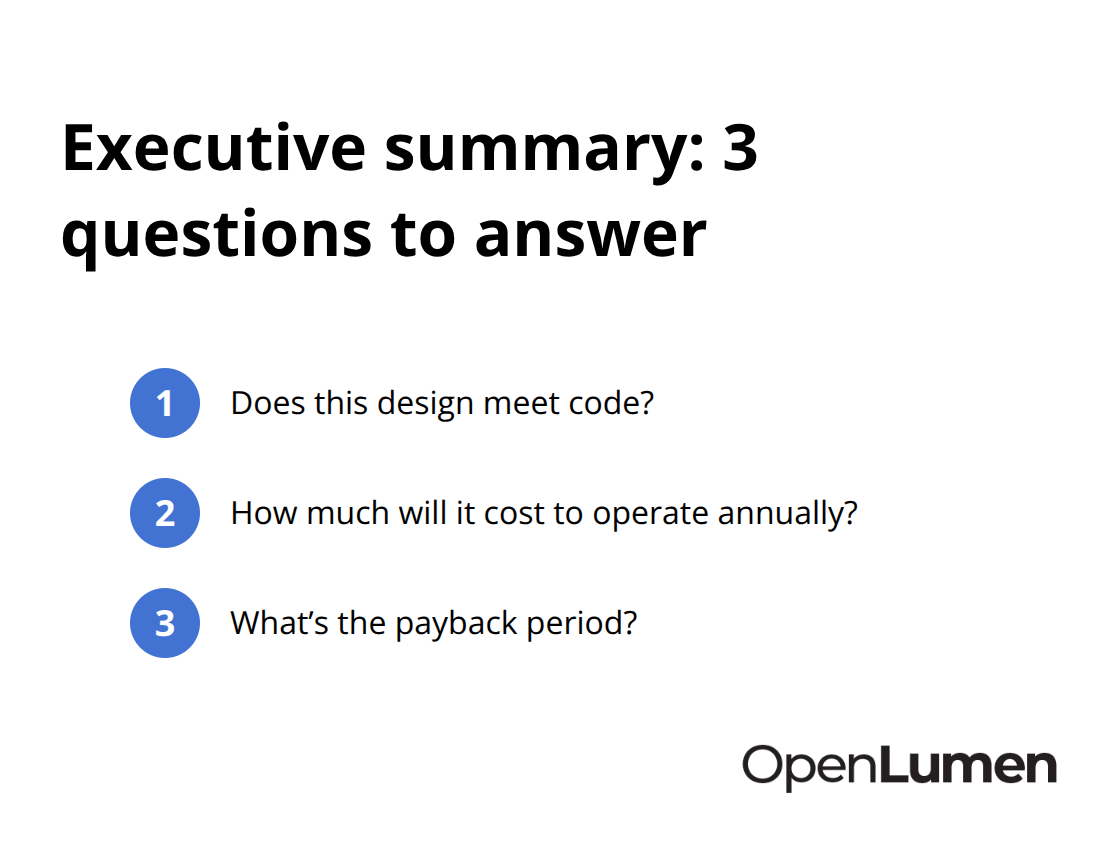
Clients don’t care about lux calculations or uniformity ratios until you show them what those numbers mean for their wallet and their space. Most contractors lead with technical metrics instead of business outcomes, and proposals fail because the footcandle grid sits on page eight without explaining why those specific light levels matter. Start your report with a one-page executive summary that answers three questions: Does this design meet code? How much will it cost to operate annually? What’s the payback period?
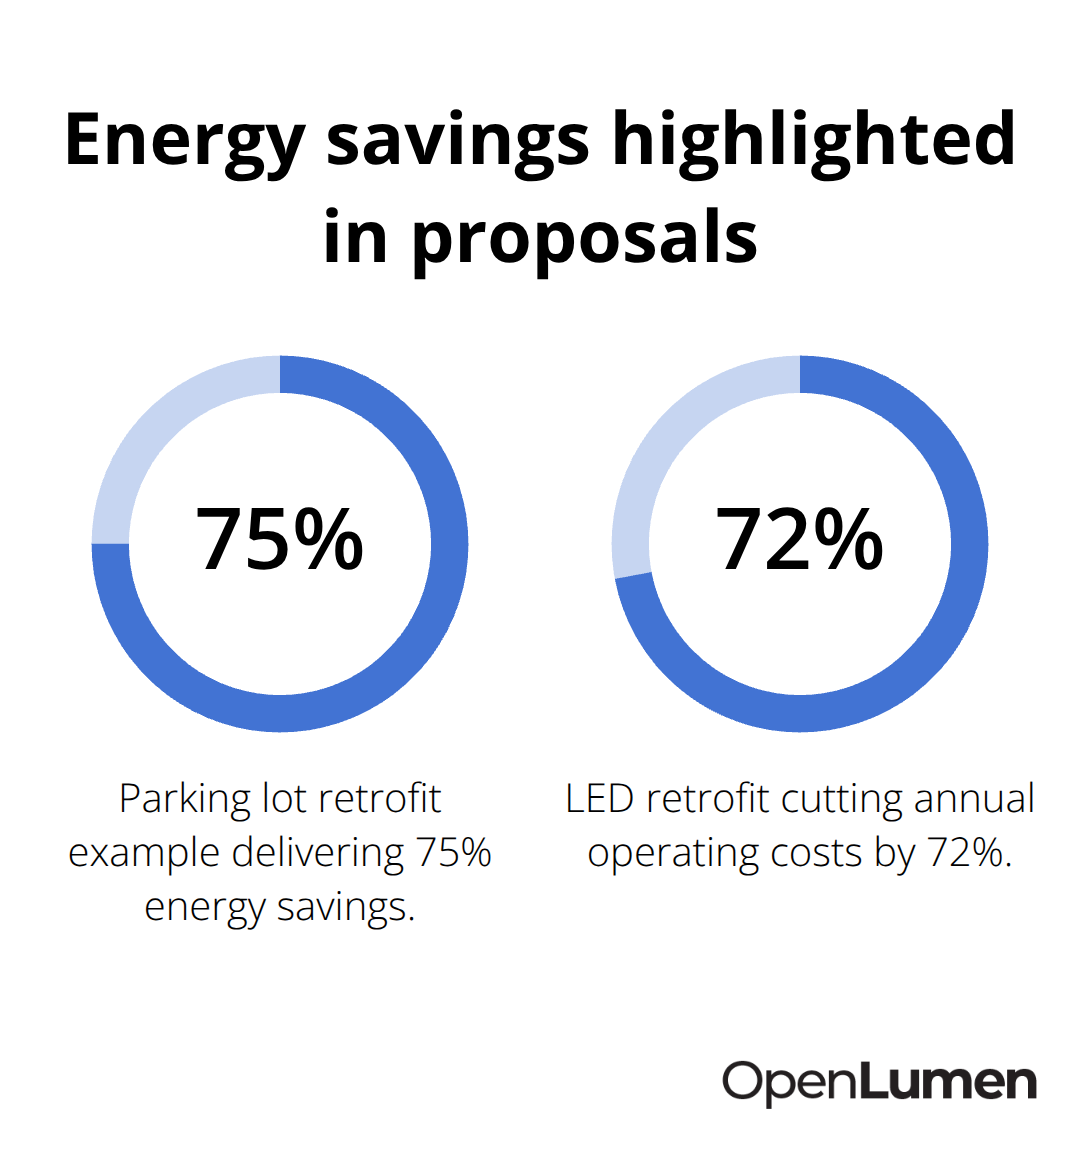
A parking lot owner doesn’t need to understand that you’re targeting 2.5 footcandles for a Type C lot. They need to know the LED retrofit cuts their annual lighting bill from $8,400 to $2,100, delivering a five-year payback and 75% energy savings. Include a simple table showing current annual energy cost, proposed annual cost, and net savings over 5, 10, and 15 years. This transforms abstract calculations into decisions clients can justify to their finance team.
Show Exactly Where Light Lands
A fixture layout diagram without context is useless; annotate it with the pole spacing, mounting height, and aiming angle so the client understands why you chose that configuration. Include a heat map alongside the footcandle grid so non-technical stakeholders see at a glance which zones are bright and which are dim. For a warehouse retrofit, present the before-and-after heat map side by side with the energy comparison table.
A 3D isometric rendering adds confidence because clients see the actual space, not just a top-down plan. Many competitors skip this step and lose deals to firms that include it. When you present a professional photometric report with clear layout diagrams, heat maps, and ROI projections, you’re not asking the client to trust your expertise-you’re showing them proof that your design solves their problem and saves them money.
Make Data Visual and Accessible
Heat maps using pseudo-color gradients make light distribution intuitive without requiring technical knowledge. Isolux contour lines show where light falls off across the space, helping clients visualize coverage quality. A luminaire schedule that lists catalog numbers, wattage, lumen output, NEMA beam angles, color temperature, and fixture count ties the visual design to the actual products you’re quoting.
Real-world projects show that adding ROI data to proposals increases close rates by making the business case transparent and measurable. The distinction between a proposal that asks for trust and one that shows proof determines whether you win or lose the deal. This foundation of clear visuals and financial clarity positions you to address the mistakes that derail even technically sound designs.
Common Mistakes in Photometric Reporting
Sparse Grids Hide Problems
Most contractors and lighting designers lose deals not because their calculations are wrong, but because they present data in ways that confuse rather than convince. A sparse footcandle grid with 10 or 15 calculation points looks incomplete to any code official or experienced facility manager-it signals you cut corners. Professional reports need at least 50 to 100 calculation points across the illuminated area to catch dark spots and demonstrate thoroughness. Many firms skip heat maps entirely, forcing clients to squint at numbers they don’t understand instead of seeing light distribution at a glance. When you omit isolux contour lines, fixture layout annotations, or a luminaire schedule with exact catalog numbers and wattage, the proposal reads as generic rather than tailored. Clients notice this immediately.
A parking lot owner comparing three bids will favor the proposal that shows a color-coded heat map with clear pole positions over one that buries footcandle data in a table on page six. The visual hierarchy matters more than most contractors realize. If your best information sits buried in technical details, busy facility managers won’t find it, and the deal goes to whoever presented it clearly.
Disconnecting Data From Client Needs
The second critical mistake is treating photometric data as standalone information instead of connecting it to what the client actually cares about. A warehouse manager needs to know whether your 50-footcandle recommendation meets OSHA standards for their specific task areas, not just see that you hit 50 footcandles on average. Include a brief explanation of which standard applies, why that standard matters for their operation, and how your fixture layout achieves it.
For sports facilities, state the NCAA or IES uniformity ratio requirement upfront, then show your design meets or exceeds that target with a clear comparison table. Too many reports present technical compliance as a checkbox rather than a selling point. This approach leaves money on the table.
Burying Financial Impact
Energy savings projections belong in the executive summary, not on page 12. Clients make budget decisions in the first two minutes of reviewing a proposal; if your ROI math isn’t visible by page one, they’ve already moved to the next option. If your LED retrofit cuts annual operating costs by 72%, lead with that number alongside the payback period before showing any footcandle grid.
The difference between winning and losing often comes down to whether you present photometric data as a technical requirement or as proof that your design solves the client’s problem at the lowest cost. Position financial impact where decision-makers will see it first.
Final Thoughts
Professional photometric reports succeed when they combine accurate calculations using manufacturer IES data, clear compliance documentation tied to the standards your client must meet, and visuals that make the business case obvious at a glance. Without all three, even technically sound designs fail to convert. The footcandle grid, heat map, fixture layout, and luminaire schedule form the foundation, but the executive summary showing annual energy savings and payback period closes deals because clients decide in the first two minutes whether your proposal deserves serious consideration.
Professional photometric reports accelerate your sales process because they eliminate uncertainty. A facility manager comparing three bids will choose the proposal that shows proof over one asking for trust. When you present a color-coded heat map with exact pole positions, a clear luminaire schedule with catalog numbers and wattage, and a table showing five-year and ten-year energy savings, you compete on value rather than price.
Code officials approve permits faster when your report cites the applicable standard and demonstrates compliance with calculation grids that show adequate coverage. Architects and engineers recommend your design when the visual presentation is professional and the data is thorough. Standardize your executive summary format so every proposal leads with business outcomes, load the exact manufacturer IES file for each fixture model you quote, add heat maps and isolux contour lines to every report, and present energy savings on page one where decision-makers will see them first-these steps transform your workflow and help you win more projects.
The information provided is for general educational purposes only and should not be considered professional engineering or lighting design advice. Always verify project requirements, local codes, and specifications with qualified professionals before making final decisions.