Lighting proposals often fail because they lack the data clients need to make confident decisions. A professional lighting report bridges that gap by showing exactly what your design will deliver.
At OpenLumen, we’ve seen how the right documentation transforms a vague estimate into a compelling proposal. When you include photometric data, compliance proof, and visual renderings, clients understand the value and approve projects faster.
Why Professional Reports Win Projects
Professional lighting reports stop the back-and-forth that kills deals. Contractors and designers who skip detailed documentation lose projects to competitors who provide them. Clients need proof that a lighting design will work before they sign a check, and vague descriptions or rough sketches do not cut it. A solid report shows illuminance levels, fixture placement, compliance status, and visual impact in one package. This eliminates the guesswork that leads to scope creep, change orders, and site conflicts.
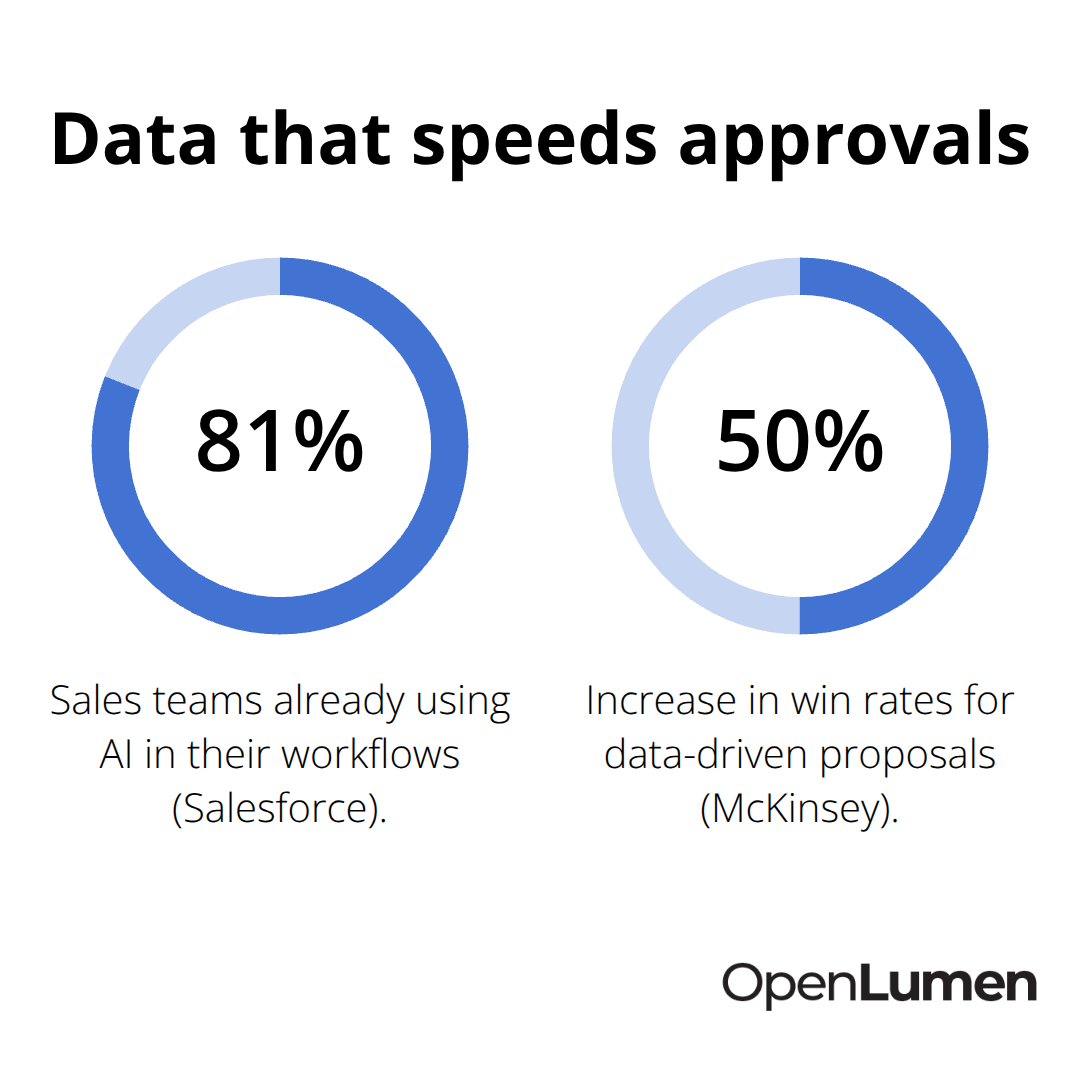
Salesforce reports that 81% of sales teams already use AI in their workflows, and the ones winning deals fastest automate proposal generation. The reason is simple: detailed, professional documentation compresses the sales cycle. When a client sees photometric data proving a design meets code and delivers the light levels they need, approval timelines shrink from weeks to days.
How Reports Prevent Costly Mistakes
Errors on job sites happen because the proposal was too vague or the installer never saw the design intent. A lighting report with a clear fixture schedule, mounting heights, and beam angles prevents costly mistakes. McKinsey found that companies using data-driven proposals see win rates increase by around 50% and overall efficiency climb 30-40%. That is not a small margin. The report becomes your proof of competence, your protection against liability, and your edge in a competitive bid.
Reports Save Hours in the Design Workflow
Generating a lighting report manually takes days. You measure the space, run calculations, source fixture data, build the layout, verify compliance, and write it all up. Modern platforms compress this into hours. A browser-based tool lets you input room dimensions, select fixtures from a verified library, run real-time illuminance analysis, and export a professional report without learning CAD or photometric software.
The Lighting Research Center data shows that daylight harvesting reduces lighting energy use by 30-40% when continuous dimming is controlled by a daylight sensor, and a report that documents this savings potential makes the ROI case for the client instantly. You save your own time and deliver faster turnaround to clients, which builds trust and wins repeat business. Contractors who turn a site visit into a proposal within 48 hours close more jobs than those who take two weeks.
Compliance and Accuracy Eliminate Site Surprises
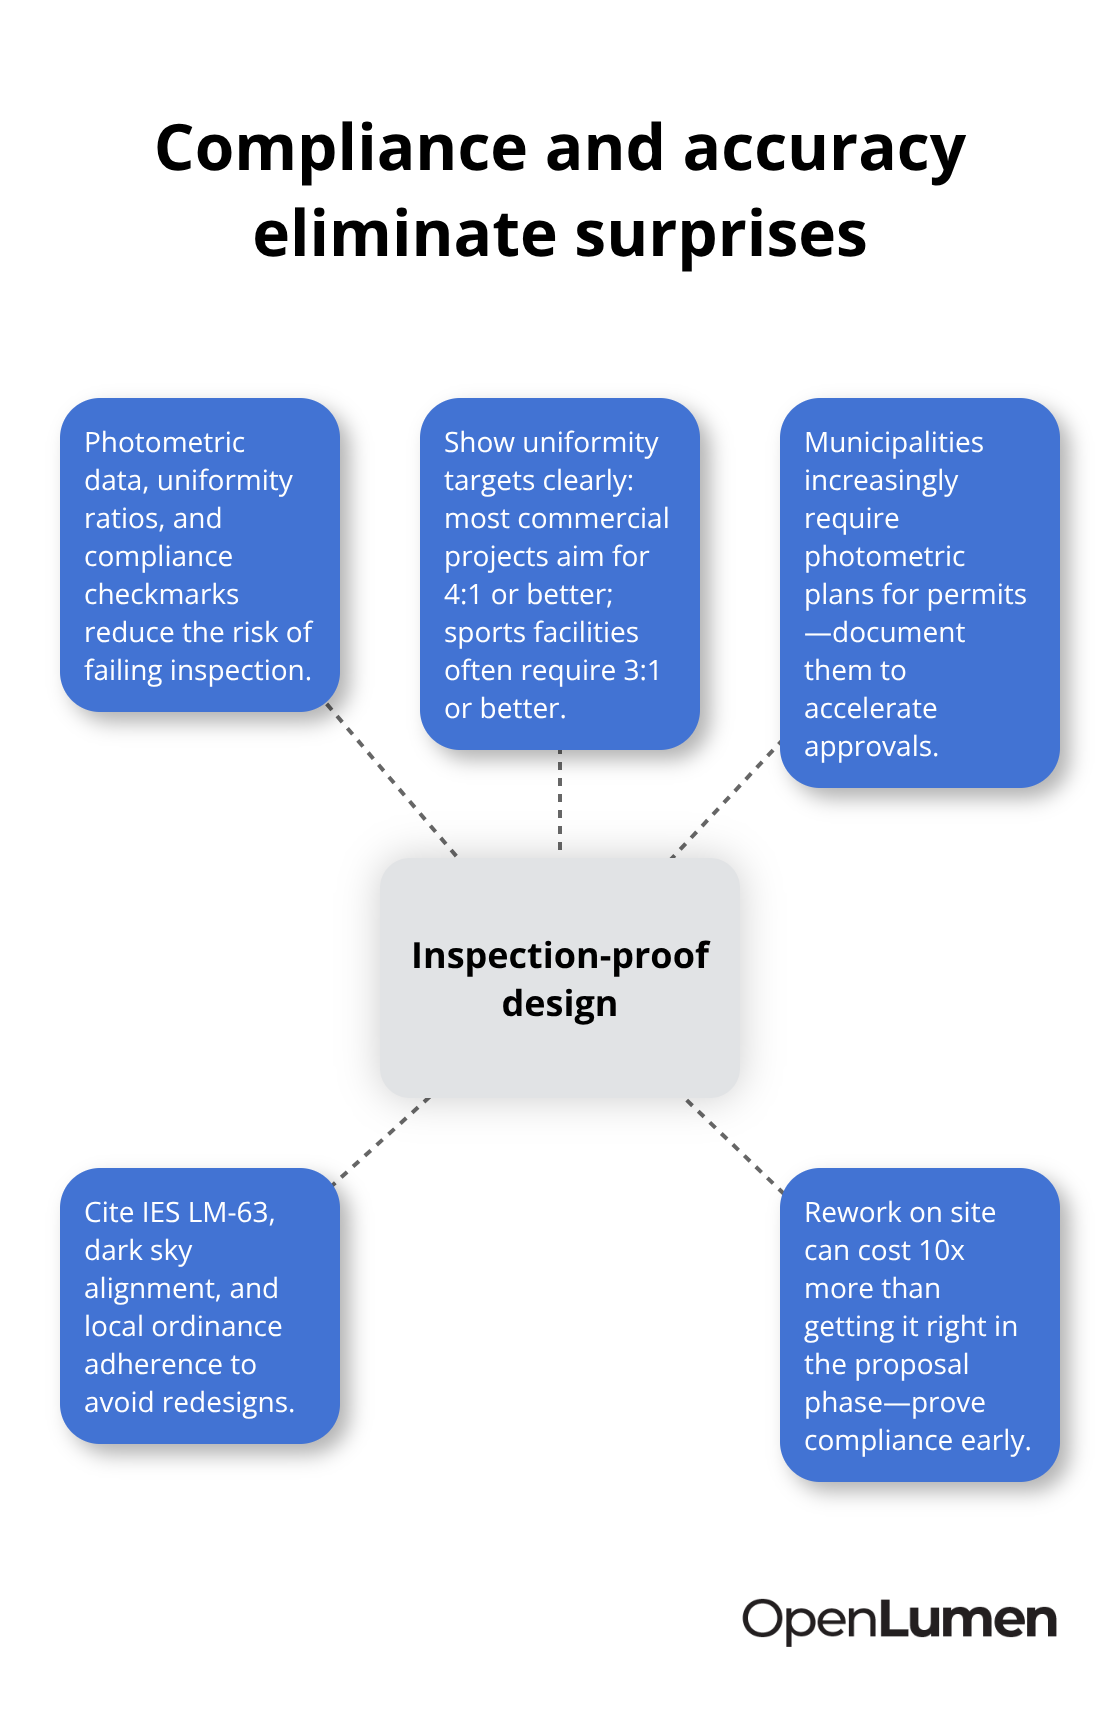
A lighting report that includes photometric data, uniformity ratios, and compliance checkmarks removes the risk of an installation that fails inspection. Most commercial projects target 4:1 uniformity or better, and sports facilities often require 3:1 or better. If your report does not show these metrics, you have no proof the design meets code.
Municipalities increasingly require photometric plans for building permits, especially for outdoor lighting in parking lots and commercial developments. A report that documents IES LM-63 compliance, dark sky alignment, and local ordinance adherence gets approvals faster and prevents costly redesigns after installation starts. The cost of a rework on site is ten times the cost of getting the design right in the proposal phase. What you include in your report determines whether the next phase moves forward smoothly or stalls.
What to Include in Your Lighting Report
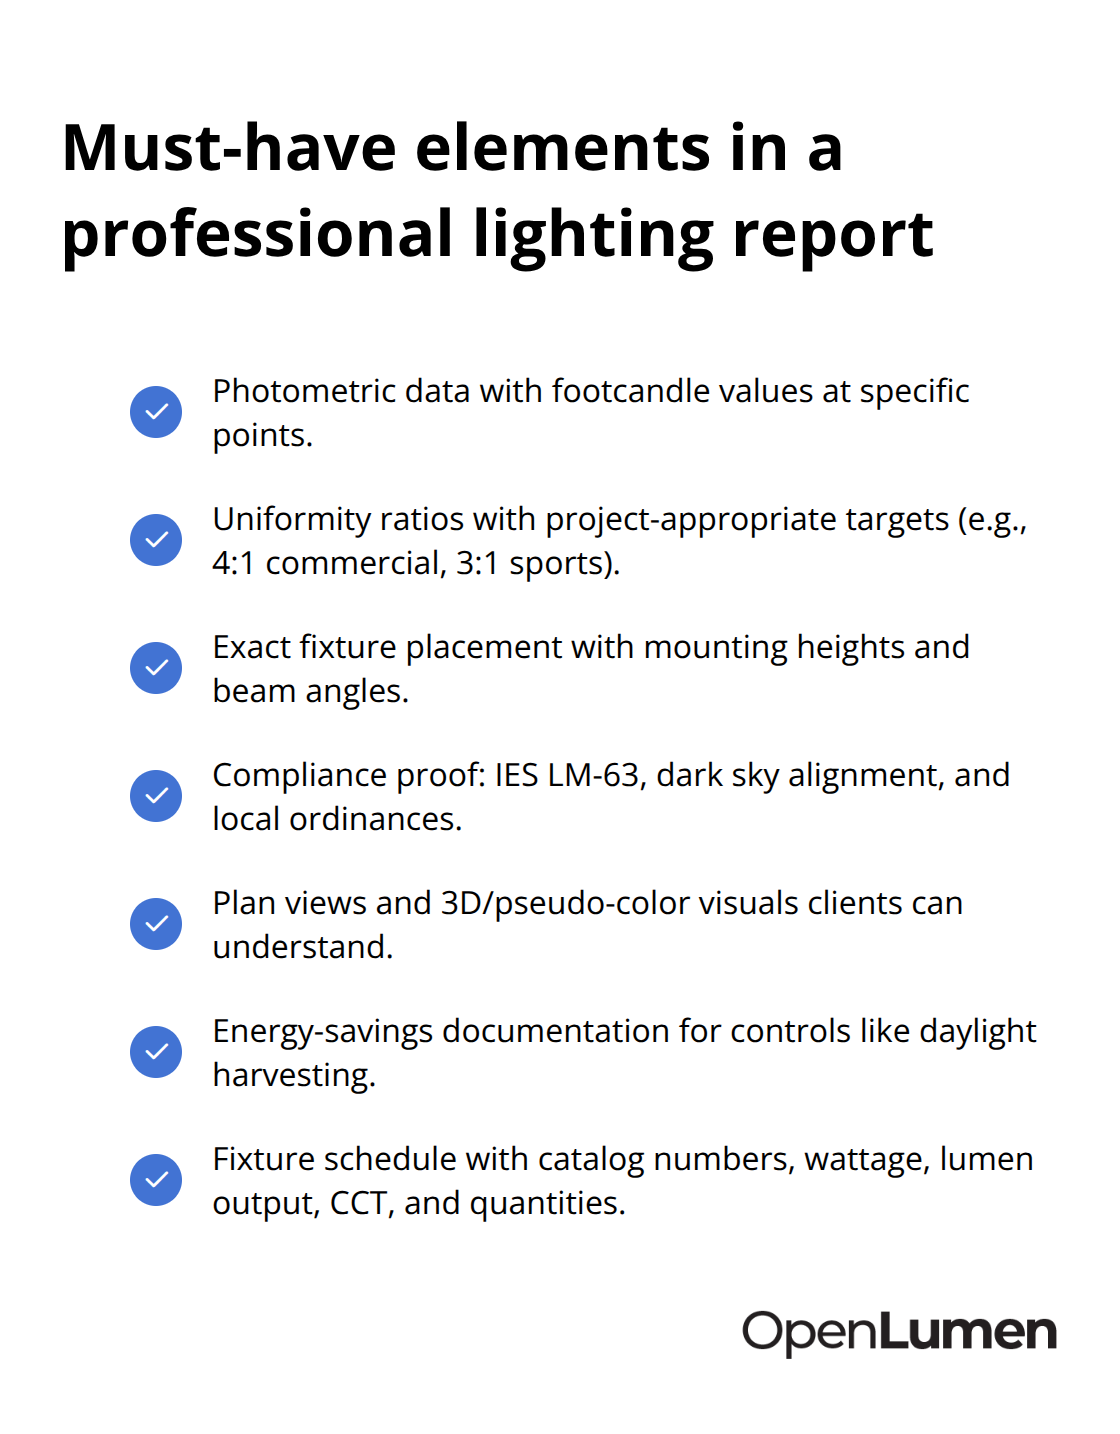
A lighting report without photometric data is just a guess dressed up as a proposal. The report must show footcandle values at specific points in the space, uniformity ratios, and fixture placement with exact mounting heights and beam angles. This is non-negotiable. A kitchen renovation needs to show that under-cabinet lighting delivers 50 footcandles on the work surface, and a parking lot retrofit must prove that average illuminance meets the 1.0 footcandle minimum while maintaining a 4:1 uniformity ratio.
Without these numbers, the client has no way to know whether your design actually works.
Fixture Schedules and Photometric Grids
Include a luminaire schedule that lists every fixture type, its catalog number, wattage, lumen output, color temperature, and quantity. This prevents the installer from substituting a wrong fixture on site. Add a footcandle grid-a heat map showing light intensity across the floor plan at hundreds or thousands of points. Most commercial projects target 4:1 or better uniformity; sports facilities often require 3:1 or better. A professional report shows this data clearly so there is no ambiguity about whether the design meets code.
Visual Layouts That Clients Understand
Clients approve projects faster when they see what the space will look like. Include a plan view showing fixture locations, mounting heights, and aiming angles overlaid on the floor plan. Add a 3D isometric rendering or pseudo-color heat map so the client visualizes how light intensity varies across the space. These visuals communicate design intent that numbers alone cannot. For outdoor projects, include dark sky compliance data showing uplight and light trespass calculations so the client knows the design respects local ordinances. For indoor spaces, show how layered lighting creates ambiance: a living room plan might show 3,000 lumens from a central ceiling fixture, two 1,000-lumen wall sconces, and two 500-lumen table lamps totaling 6,000 lumens. This breakdown proves the design is intentional, not arbitrary.
Compliance Data That Survives Inspection
Your report must prove the design meets applicable codes and standards. For indoor projects, reference ASHRAE 90.1 or local energy codes; for outdoor work, cite IES, AASHTO, and municipal dark sky ordinances. Include the IES LM-63 file data used for calculations-this proves accuracy because photometric software relies on manufacturer-provided files. State which fixtures are DLC qualified if they are; DLC qualification signals that the product meets rigorous performance and control standards.
Energy Savings and Cost Justification
If the design includes controls like occupancy sensors or daylight harvesting, document the expected energy savings. Daylight harvesting reduces lighting energy use by 30-40% when continuous dimming is controlled by a daylight sensor, according to the Lighting Research Center. A report that quantifies this savings justifies the control investment to cost-conscious clients. For retrofits, include a maintenance comparison showing the cost difference between legacy lighting and LED over the fixture lifetime. These compliance and cost documents transform a proposal from a guess into a credible, defensible plan that survives inspection and client scrutiny.
Municipalities increasingly require photometric plans for building permits, especially for outdoor lighting. A report with clear visual layouts accelerates permit approval and eliminates costly redesigns after work begins. Once you know what data to include, the next step is generating these reports efficiently without expensive software or months of training.
Generating Professional Reports Without Expensive Software
Manual report creation wastes hours. You spend time in CAD, hunt for fixture specifications, run calculations separately, then assemble everything into a PDF. Browser-based platforms eliminate this workflow entirely. A modern lighting platform lets you input room dimensions, select fixtures from a verified library, generate photometric data in real time, and export a client-ready report in minutes instead of days. The cost difference is significant: traditional photometric software costs $500 to $2,000 per study for independent professional analysis, while browser-based tools cost nothing or a fraction of that. More importantly, you control the timeline. A contractor who turns a site visit into a proposal within 48 hours closes deals faster than one waiting for an external consultant to deliver a study. Speed matters because clients compare proposals side by side, and the first detailed proposal on their desk often wins the bid.
Automate Data Collection From Verified Libraries
The real efficiency gain comes from automating data collection and tailoring reports to different audiences. A verified luminaire library eliminates the hunt for IES files and specifications; you click a fixture, and its photometric data, lumen output, wattage, color temperature, and catalog number populate automatically. This prevents the errors that happen when you manually type numbers or use outdated spec sheets. For a kitchen renovation targeting 50 footcandles on work surfaces or a parking lot retrofit needing 1.0 footcandle average with 4:1 uniformity, you validate these requirements in the same tool where you design.
Customize Reports for Each Stakeholder
Different stakeholders need different information. An electrical contractor needs the fixture schedule and mounting heights; a facility owner cares about energy savings and compliance proof; an architect wants visual renderings and uniformity data. A single calculation generates multiple report versions without recalculating anything. This customization matters because it proves you understand each stakeholder’s priorities, which builds confidence faster than a one-size-fits-all proposal.
Eliminate Software Switching and Manual Cross-Checking
No switching between platforms, no manual cross-checking, no delays waiting for photometric software to render. OpenLumen streamlines this exact workflow with real-time illuminance analysis and instant report generation, so you focus on design intent rather than software mechanics. The platform’s community-verified luminaires library means the fixture data you use is accurate and current, eliminating the liability risk of outdated specifications. The result is faster turnaround, fewer errors, and proposals that survive inspection because they are built on verified data from the start.
Final Thoughts
Professional lighting reports transform how you win projects and execute them successfully. The reports you create today determine whether installations run smoothly or stall with costly surprises. When you include photometric data, compliance proof, visual layouts, and energy savings analysis, clients move from skepticism to confidence in hours instead of weeks.
Streamlined professional lighting reports generation eliminates the friction that kills deals. A contractor who delivers a detailed proposal within 48 hours of a site visit beats competitors who take two weeks, and the data proves this advantage matters: teams using data-driven proposals see win rates increase by around 50% and efficiency climb 30-40%. That margin translates directly to closed jobs and higher margins because you spend less time on revisions and change orders.
Stop treating reports as an afterthought and make them your competitive weapon. Use verified fixture libraries to eliminate data errors, generate photometric grids that prove your design meets code, and create visual renderings that help clients see the finished result. Browser-based platforms now handle the heavy lifting so you focus on design intent rather than software mechanics, and OpenLumen delivers exactly this with real-time illuminance analysis, community-verified luminaires, and instant report generation without CAD training or expensive software licenses.
The information provided is for general educational purposes only and should not be considered professional engineering or lighting design advice. Always verify project requirements, local codes, and specifications with qualified professionals before making final decisions.