IES files contain the photometric data that determines how light actually behaves in real spaces. Without understanding how to read them correctly, you’re essentially designing in the dark.
At OpenLumen, we’ve seen countless lighting projects fail because teams misinterpreted this data or skipped verification altogether. This guide walks you through the essentials so you can confidently work with photometric information and make better design decisions.
What IES Files Actually Tell You
The Light Distribution Fingerprint
An IES file is a text-based record of how a specific light fixture distributes light in three-dimensional space. It contains luminous intensity values measured at precise angles, following the IESNA LM-63-2002 standard. When you load an IES file into design software, you import the fixture’s light distribution fingerprint-the exact pattern of how many candelas it produces at every angle from its mounting point. This matters because two fixtures with identical lumen outputs distribute light completely differently. One concentrates light straight down, while another spreads it wide. Without the IES file, you guess. With it, you know exactly what happens when that fixture installs in your space.
How Photometric Data Drives Real Results
Photometric data from IES files directly determines whether your design meets real-world requirements or falls short. When you calculate illuminance (measured in lux) on a work surface, you use intensity values from the IES file combined with distance and angle. A fixture 3 meters above a desk produces a different lux level than one 2 meters above, and the IES file lets you predict that difference accurately before installation. Contractors and designers who skip IES verification end up with spaces that are either too dark (creating complaints and rework) or too bright (wasting energy and money). Property owners increasingly demand documentation that designs meet codes like IESNA RP-1 or local standards. IES files provide that proof.
Who Relies on IES Data
Architects use photometric data to validate glare ratings and uniformity ratios, protecting occupant comfort. Distributors who understand IES data sell the right fixture for the job instead of oversizing or undersizing based on wattage alone. Manufacturing facilities, sports venues, retail environments, warehouses, and office buildings all depend on accurate photometric analysis to optimize both performance and energy budgets. The cost of getting it wrong-excess energy consumption, poor lighting quality, safety risks, or redesign expenses-far exceeds the time spent reading an IES file correctly.
Understanding what IES files contain is only half the battle. The real skill lies in extracting that data and applying it to your specific design challenge.
Extracting Data from IES Files
Understanding File Structure
An IES file opens as plain text, and the first thing most people do wrong is panic at the wall of numbers. Stop there. The structure is simple: header information at the top tells you what was tested and under what conditions, test information specifies the measurement setup, and photometric data fills the rest with luminous intensity values at specific angles. Open any IES file in a text editor and you’ll see the IESNA version, manufacturer name, and test method immediately.
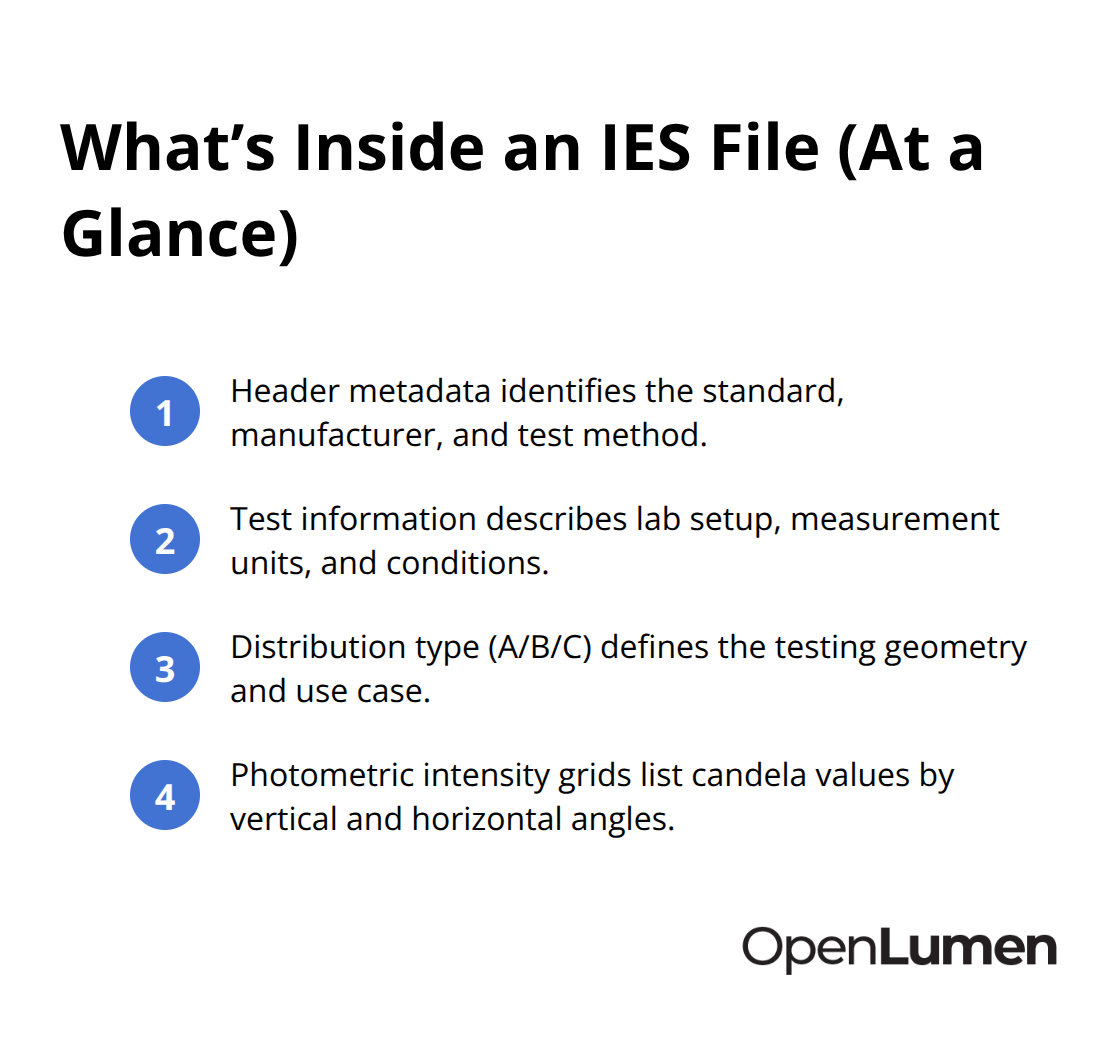
This metadata confirms the data came from a legitimate photometric test using a goniophotometer, not guesswork.
The test information section reveals critical details like the number of light sources in the fixture, whether measurements were taken in candelas or lumens per steradian, and the distribution curve type-Type A, B, or C. Each type represents a different testing geometry. Type C works best for downlights and spotlights because it measures around the vertical axis. Type A suits asymmetric distributions like wall washers. Knowing your distribution type prevents misinterpreting the angular data that follows.
Decoding Angles and Intensity Values
The photometric data itself contains vertical angles (gamma angles) and horizontal angles (C-plane angles) paired with candela values at each intersection. A typical IES file measures intensity at 5-degree increments across 360 degrees horizontally and 0 to 180 degrees vertically, creating a complete three-dimensional picture of light output.
Reading the actual numbers requires understanding what you’re measuring. Candela values tell you directional intensity-how much light goes in a specific direction. A fixture might produce 5,000 candelas straight down but only 200 candelas at a 60-degree angle. This difference is everything when you calculate illuminance on a surface. The formula is straightforward: lux equals candelas divided by distance squared, multiplied by the cosine of the angle of incidence. So a fixture 3 meters above a work surface with 2,000 candelas pointed straight down produces roughly 222 lux on that surface. Move that same fixture to 4 meters and it drops to 125 lux. Change the angle and the multiplier shifts.
Visualizing Light Distribution with Polar Diagrams
Polar diagrams visualize this data by plotting candela values as distances from a center point, creating a shape that shows where light concentrates and where it falls off. A narrow, elongated polar diagram means directional light; a wide, round one means diffuse light. When you load an IES file into design software like DIALux or Photopia, the software performs these calculations automatically at dozens or hundreds of points across your space, generating an illuminance map that shows lux levels everywhere.
If you’re checking calculations manually or comparing fixtures before software analysis, pick specific measurement points-your work surface, floor, or wall-and work backward from the polar diagram to find candela values at the angles that matter. Misreading angles is the most common mistake. Vertical angles are measured from the fixture’s downward direction, so 0 degrees is straight down, 90 degrees is horizontal, and 180 degrees is straight up. Horizontal angles wrap around the fixture. Get these wrong and your calculations are worthless.
Avoiding Common Interpretation Errors
The second mistake is ignoring intensity falloff. A fixture with 10,000 lumens looks impressive until you check the polar diagram and see that most of that light spreads wide and shallow, producing weak illuminance far from the fixture center. Verify that the distribution actually matches your spacing and mounting height before finalizing your layout.
These details matter because they separate designs that work from designs that fail. Once you extract and interpret the data correctly, you’re ready to apply it to your actual space-and that’s where most teams stumble.
Where IES Data Goes Wrong
Most teams fail not because they cannot find IES files, but because they mishandle the data once they have it. The mistakes happen in three places: during interpretation, during verification, and during application. A lux calculation error of just 10 percent sounds minor until you realize it means your design delivers 90 lux instead of 100 lux on a task surface that requires 300 lux for safety compliance. Contractors install fixtures based on faulty photometric analysis and end up redesigning layouts mid-project, eating costs and missing deadlines. The fix is straightforward: treat IES data with the same rigor you apply to structural calculations.
Measurement Units Trip Up Even Experienced Teams
Candela, lumens, lux, and foot-candles are not interchangeable, yet many designers mix them without realizing the damage. Candela measures directional intensity from a point source. Lumens measure total light output from a fixture. Lux measures illuminance on a surface, calculated from candela, distance, and angle.
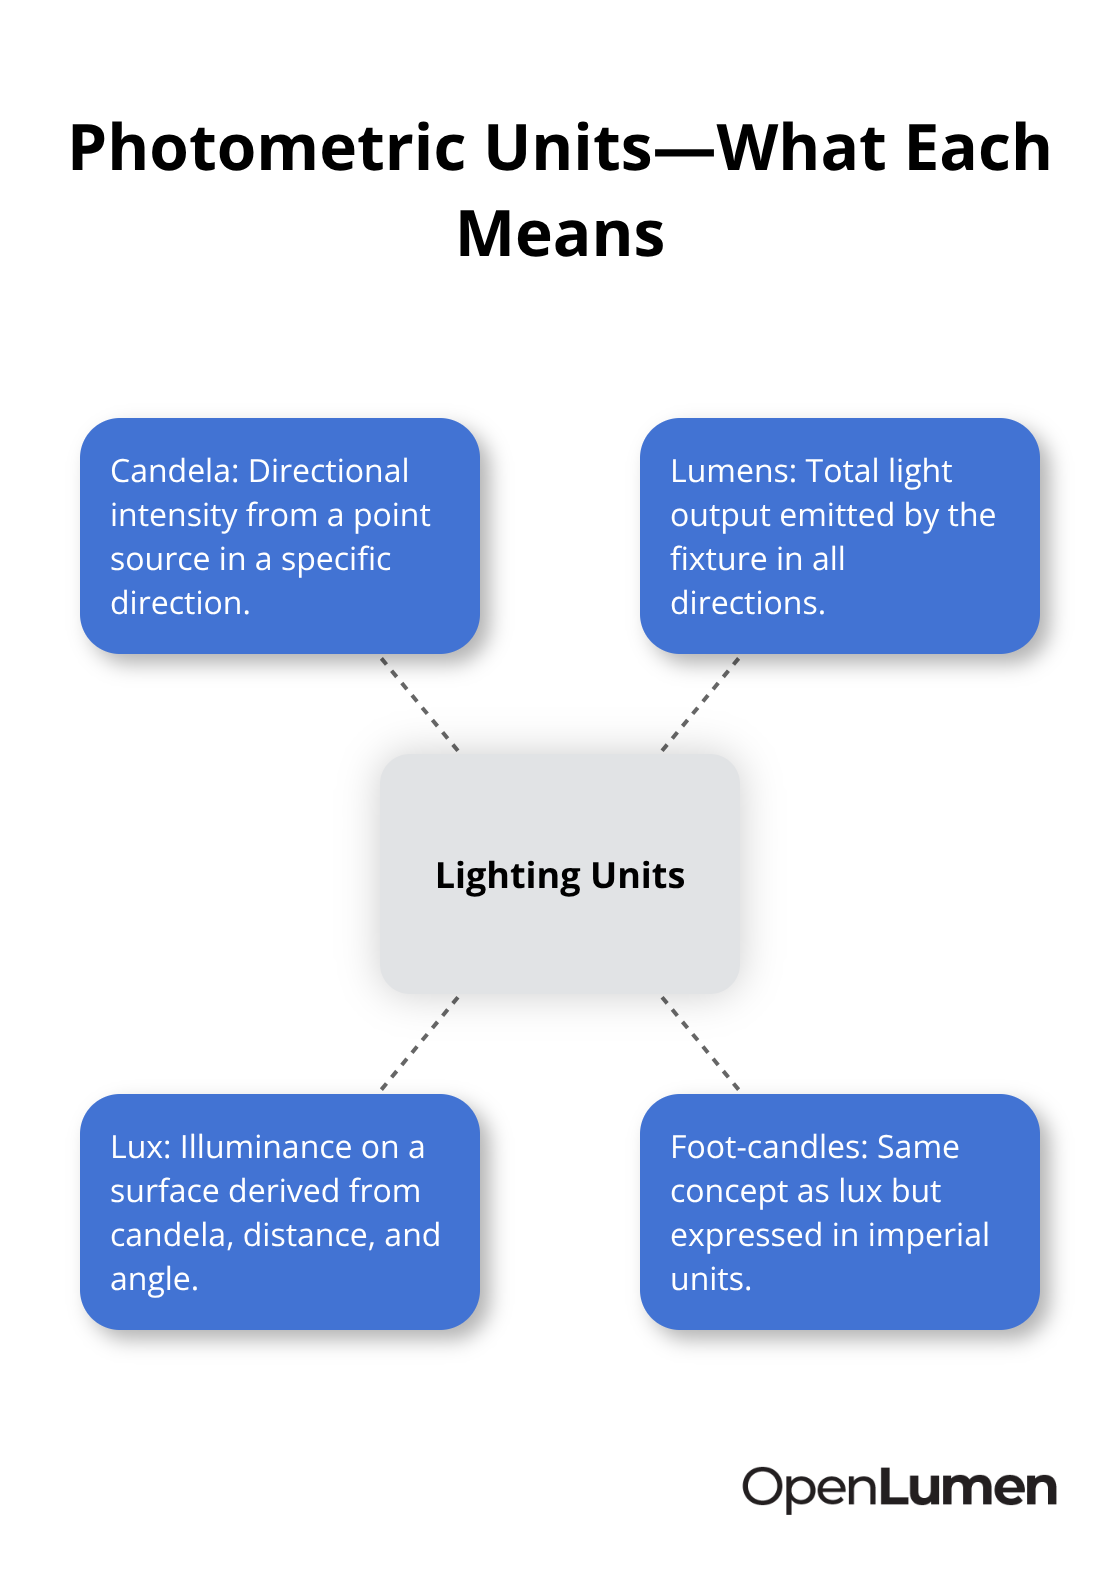
Foot-candles do the same thing as lux but use imperial units. A fixture with 50,000 lumens total output might produce only 1,200 candelas in its peak direction and deliver 85 lux on a surface 4 meters away. If you confuse lumens with candela, you overestimate intensity by orders of magnitude and your calculations become fiction.
The IES file always specifies which unit applies in the test information section. Read it. The IESNA LM-63-2002 standard requires test labs to declare whether measurements are in candelas or lumens per steradian. If you skip this step, you build on sand. Another common error: you treat a fixture’s rated lumen output as if it distributes evenly across space. It doesn’t. A 10,000-lumen downlight might concentrate 8,000 lumens within a 30-degree cone below it and scatter only 2,000 lumens elsewhere. The polar diagram shows this distribution, but many teams glance at the lumen number and assume uniform spread. Load the IES file into DIALux or similar software and you generate an actual illuminance map. The numbers will shock you.
Source Verification Separates Reliable Data from Guesses
Not all IES files are created equal. A file from a reputable photometric testing lab following IESNA standards carries weight. A file generated by a fixture manufacturer’s internal testing might be optimistic. A file you downloaded from an unvetted source could be completely fabricated. Before you base a design decision on IES data, you verify its origin. Legitimate IES files include the test lab name, test date, and goniophotometer model in the header. If that information is missing or vague, you question the file.
The IESNA publishes accredited testing labs on its website. Cross-reference your file’s source against that list. If a manufacturer won’t provide the test lab name or refuses to share the complete IES file header, that’s a red flag. Secondly, you verify consistency between the IES file and the fixture’s spec sheet.
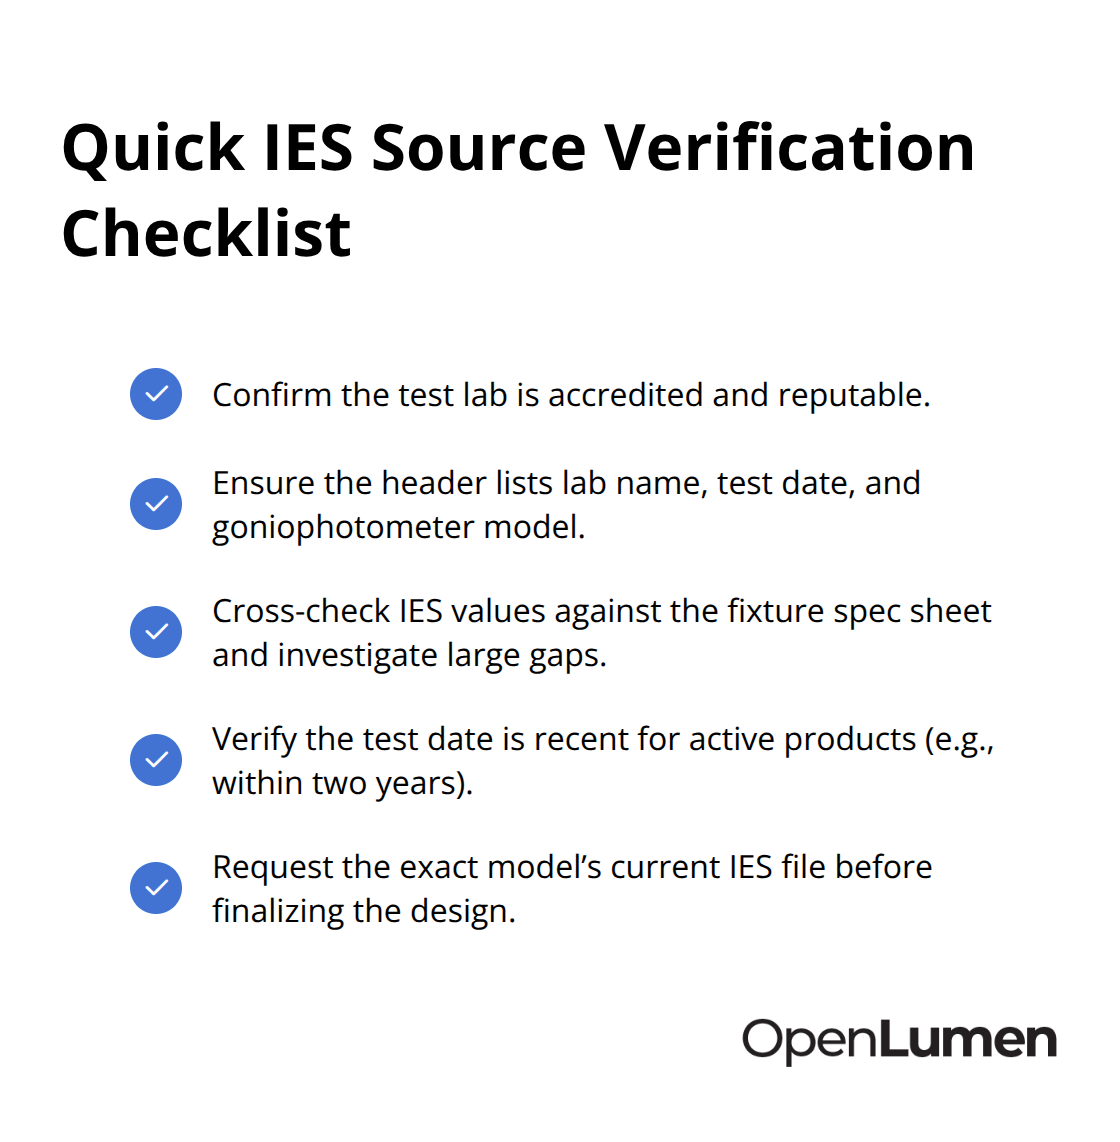
If the spec sheet claims 15,000 lumens but the IES file shows 12,500 lumens, you investigate the discrepancy. Different test conditions can explain minor variations, but large gaps indicate either an error or intentional data manipulation. Third, you check the test date. Photometric data from 2015 might not match a fixture’s current production run if the manufacturer revised optics or light sources. You request an IES file tested within the last two years for active product lines. Older files can still prove useful for legacy fixtures, but newer is more trustworthy.
Application Errors Waste Design Time and Money
Even perfectly accurate IES data produces bad results when applied incorrectly. The most frequent mistake: you use IES data from one fixture type to estimate performance of another. A designer might test a 4000K LED downlight, get its IES file, then assume a 2700K version of the same fixture will perform identically. Color temperature doesn’t change intensity distribution much, but different optics or reflectors do. The 2700K version might have a wider beam angle, shifting the entire distribution curve. You never assume similarity. You always use the correct IES file for the exact fixture model you install.
Second error: you forget to account for mounting angle. An IES file for a wall sconce assumes a specific mounting orientation, usually vertical. If you rotate it 45 degrees to create an angled effect, the polar diagram no longer applies. The fixture’s light distribution rotates with it, changing where illuminance lands. Design software handles this automatically when you orient fixtures correctly in your model, but manual calculations require you to mentally rotate the polar diagram-a step many teams skip. Third: you ignore beam spread in relation to fixture spacing. A fixture with a 40-degree beam angle might seem ideal for a 4-meter spacing, but if the polar diagram shows intensity falls to 10 percent of peak at the beam edge, you’ll get uneven lighting with dark zones between fixtures. You check the isocandela diagram or illuminance contours in your design software to confirm spacing actually works.
Fourth: you apply IES data without considering surface reflectance. A 300-lux calculation assumes you’re measuring on a neutral surface. Dark finishes absorb more light and feel dimmer. Shiny surfaces bounce light unpredictably. The IES file tells you what the fixture produces, but the space determines what you perceive. You verify your design with actual material samples and mockups, not just calculations.
Final Thoughts
Reading IES files correctly transforms how you approach lighting design. Photometric data isn’t optional information you glance at before ordering fixtures-it’s the foundation that separates designs that perform from designs that disappoint. Modern design software removes much of the manual calculation burden, with tools like DIALux, Photopia, and Revit automating illuminance mapping, glare analysis, and fixture scheduling once you load an IES file. These platforms handle angular conversions and distance calculations instantly, letting you test layouts in minutes instead of hours.
The real advantage isn’t speed alone-it’s confidence. When software generates an illuminance map showing exactly where light lands in your space, you see problems before they become expensive mistakes. Start by requesting complete IES files from manufacturers and verify their source against accredited testing labs. Load them into your design software and generate illuminance maps for your actual spaces, then compare fixtures side by side using their polar diagrams rather than just lumen ratings.
OpenLumen streamlines this entire process with a browser-based platform that makes photometric analysis accessible to everyone. Our community-verified luminaires library gives you instant access to verified IES data, and our Photometric Hub displays polar charts and zonal lumens instantly. Visit OpenLumen to design with certainty and validate your layouts faster than ever before.
The information provided is for general educational purposes only and should not be considered professional engineering or lighting design advice. Always verify project requirements, local codes, and specifications with qualified professionals before making final decisions.