Most lighting designers and contractors still guess when selecting luminaires instead of using actual photometric data. At OpenLumen, we’ve seen how this approach wastes time and money on projects that don’t perform as expected.
This IES photometric data guide cuts through the confusion. You’ll learn what the numbers mean, how to read them correctly, and how to apply them to real projects.
What IES Data Actually Tells You
IES files are plain-text photometric records that describe exactly how a luminaire distributes light in three-dimensional space. They follow the LM-63 standard and contain candela values for every horizontal and vertical angle, plus lamp specifications and opening dimensions. Unlike a simple lumen rating, an IES file shows the actual light pattern-where the light goes, how intense it is at each angle, and whether it creates usable illumination or wasted glare. This matters because two fixtures with identical lumen counts perform completely differently in the same space. One concentrates light in a tight beam suitable for task areas, while another spreads light broadly across a room. Without the IES file, you select fixtures blind.
The Three Sections That Drive Real Performance
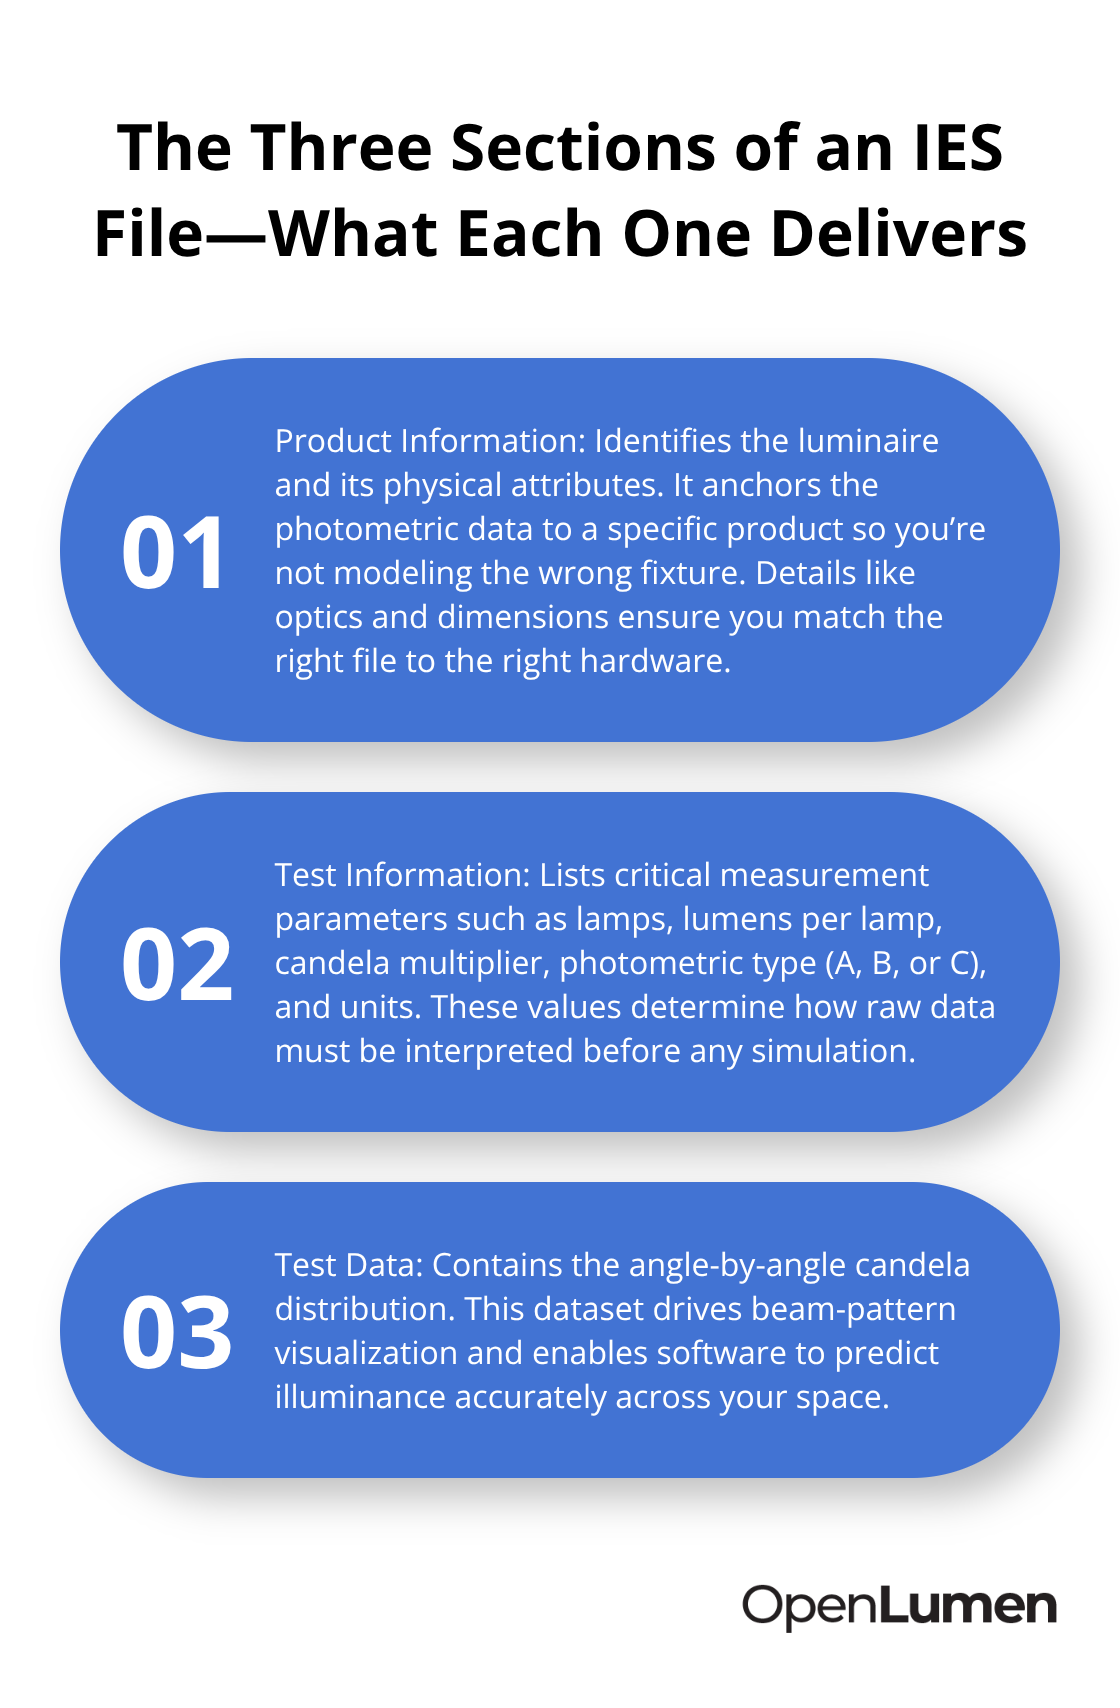
An IES file contains three structural sections: Product Information, Test Information, and Test Data. The Test Information section reveals critical numbers like the number of lamps, lumens per lamp, candela multiplier, photometric type (A, B, or C), and the measurement units. Test Data holds the candela distribution-the angle-by-angle measurements that drive beam-pattern visualization and allow software to predict actual illuminance levels in a space. When you import an IES file into design software like DIALux, AGi32, or Autodesk Revit, these candela values become the foundation for accurate ray-tracing and lighting simulations.
Matching Files to Fixtures Prevents Design Failures
Sourcing the correct IES file matters enormously. The file must match the fixture’s exact wattage, optics, and color temperature. A mismatch between the file and the actual product spec sheet leads to designs that look good on screen but fail in reality. Manufacturers provide IES files with spec sheets on request, and reputable suppliers list them on product pages or in searchable libraries like the ies-library, which hosts nearly 200,000 files. Verify that the IES file aligns with the specific product specification before importing it into your design software.
Photometric Planning Eliminates Costly Retrofits
Skipping photometric analysis costs money. A warehouse project designed without IES data often ends up with uneven light, dark spots in picking zones, or excessive glare in aisles-all requiring costly retrofits. A data-driven approach predicts these problems before installation. Using IES files and simulation software, you test multiple fixture layouts, verify that illuminance targets (30–50 fc for general warehousing, 75–150 fc for inspection zones) are met, and confirm uniformity ratios stay above 0.5 for general areas and 0.7 for high-activity zones. You also catch glare issues early by calculating Unified Glare Rating (UGR) values directly from the candela distribution.
Energy Savings Through Proper Data Use
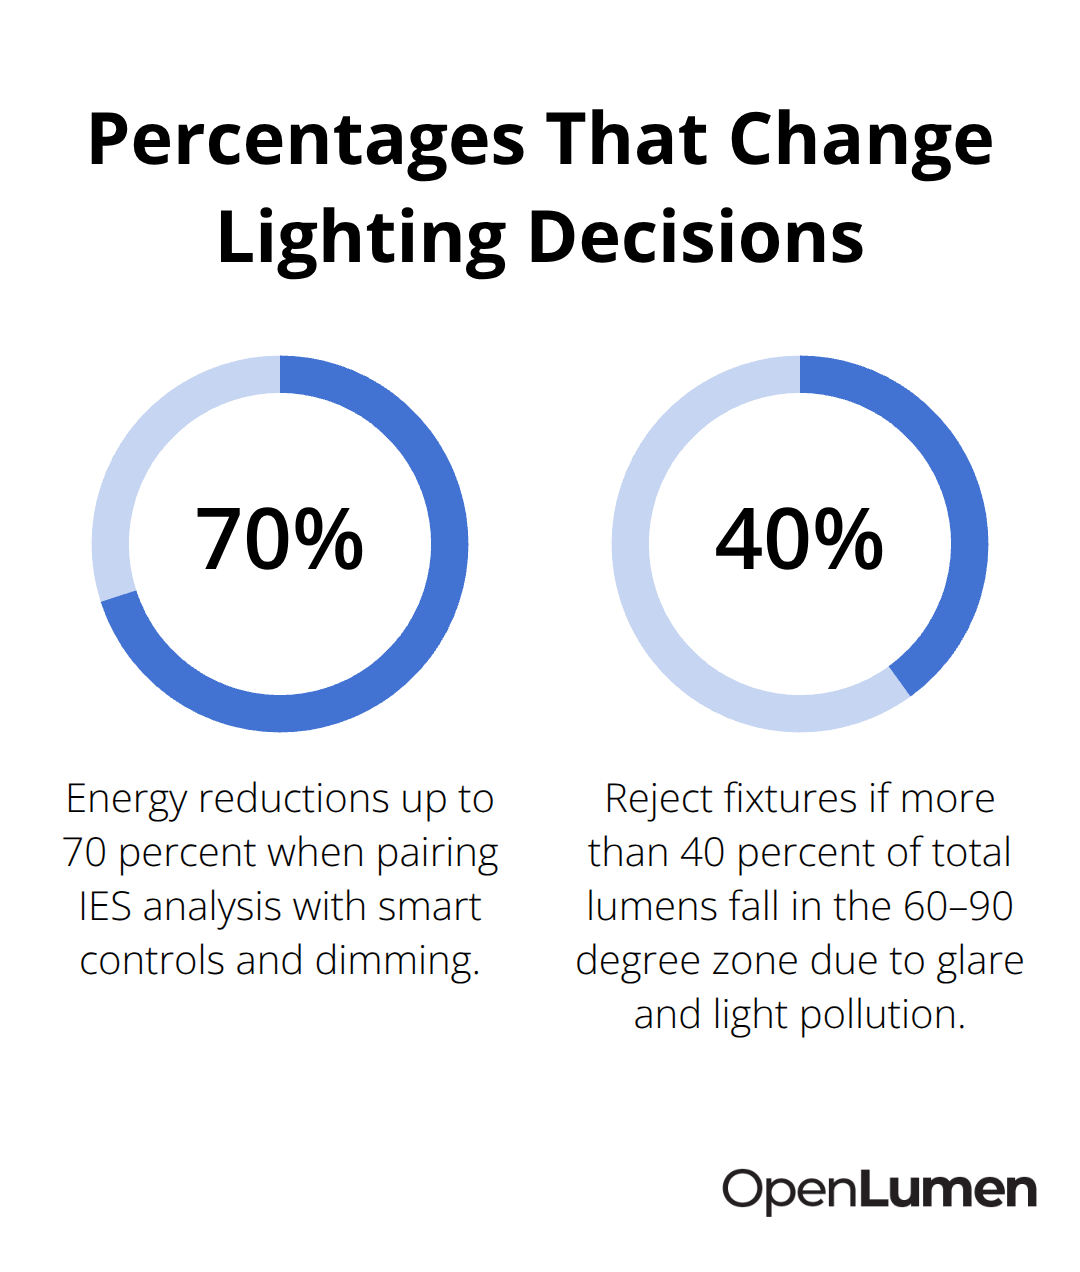
Projects that pair IES analysis with smart controls and dimming protocols achieve energy reductions up to 70 percent compared to traditional layouts. The IKEA Kaarst facility cut annual lighting energy use nearly in half in one department by applying daylighting controls alongside proper photometric planning. A professional submittal that includes the IES file, LM-79 performance report, LM-80 and TM-21 lifetime data, and UL/ETL certification reduces request-for-information delays and builds confidence with engineers and inspectors. This documentation approach transforms how teams evaluate and approve lighting projects.
Reading and Interpreting IES Files Effectively
Polar Curves Show Where Light Actually Goes
Polar curves visualize candela values plotted at every horizontal and vertical angle around a luminaire. The further the curve extends outward from the center, the more intense the light at that angle. A narrow, tight curve concentrates light in a specific direction-useful for task lighting or accent work. A broad, wide curve spreads light across a larger area, which works better for general ambient lighting.
Most contractors stop at the polar curve and assume it tells the complete story. It doesn’t. A polar curve only shows intensity distribution. It fails to show whether that intensity actually creates usable light in your space. Pair polar curves with zonal lumens and actual illuminance calculations in software like DIALux or AGi32 to see both the pattern and the practical output simultaneously.
Candela Values Reveal the Real Intensity Picture
Candela values are the raw measurements-the intensity of light in a specific direction measured in candelas. Two fixtures with identical total lumens perform completely differently. One might concentrate 5,000 candelas straight down while another spreads 2,000 candelas across multiple angles.
When reading test data in an IES file, locate the candela multiplier in the Test Information section. This number scales the raw measurements up or down. A multiplier of 1.0 means the candela values are direct. A multiplier of 2.0 means the actual intensity is twice what’s shown. Missing this detail leads to designs that predict more light than actually arrives on task surfaces. Always verify the multiplier before running any simulation.
Zonal Lumens and BUG Ratings Determine Practical Performance
Zonal lumens break down total light output by zone-typically 0–30 degrees, 30–60 degrees, 60–90 degrees, and 90–180 degrees from nadir (straight down). A fixture with most of its lumens in the 0–30 degree zone concentrates light tightly below itself. One with significant lumens in the 60–90 degree zone wastes light sideways and upward, creating glare and light pollution.
BUG ratings measure Backlight, Uplight, and Glare separately on a scale from zero to five, where zero is best. A BUG rating of B2-U1-G2 means the fixture has moderate backlight spill, minimal uplight, and moderate glare. DesignLights Consortium qualified products must meet specific BUG thresholds to earn rebate eligibility. Check the DLC listing ID and verify the BUG rating matches your project requirements. Many contractors skip BUG analysis and later discover their chosen fixtures don’t qualify for rebates.
Common Data Errors That Invalidate Simulations
Watch for mismatched zenith and nadir candela values, incomplete vertical-angle arrays, or headers that don’t conform to the LM-63 standard. These errors prevent software from rendering the beam pattern correctly and invalidate your simulation results.
Before importing any IES file into your design tool, open it in a text editor and scan the header. Look for TILT=NONE and verify the LM-63 version listed. If the file appears corrupted or incomplete, request a fresh copy directly from the manufacturer rather than guessing at corrections. Treating BUG ratings as optional information rather than a hard requirement for compliance and funding creates problems downstream.
Validating Data Quality Before Design Work Begins
The accuracy of your entire lighting design depends on the quality of the IES file you start with. A file that matches the fixture’s exact wattage, optics, and color temperature produces reliable simulations. A mismatched file produces designs that look good on screen but fail in reality.
Manufacturers provide IES files with spec sheets on request, and reputable suppliers list them on product pages or in searchable libraries. Verify that the IES file aligns with the specific product specification before importing it. This single step prevents costly retrofits and design failures that emerge only after installation begins. With validated photometric data in hand, you can now move forward to selecting the right luminaires and testing your designs against real-world performance targets.
Using IES Data to Select and Validate Luminaires
Define Performance Targets Before Selecting Fixtures
Start fixture selection by defining your performance targets, then filter luminaires against those targets using their IES files. General warehousing requires 30–50 fc of illuminance with a minimum-to-average uniformity ratio of at least 0.5. Inspection and picking zones demand 75–150 fc with uniformity ratios of 0.7 or higher. Glare must stay below UGR 25 for general areas and below UGR 22 for task-critical zones. These numbers aren’t suggestions-they’re the baseline for functional lighting.
Analyze Zonal Lumens and BUG Ratings
Open the IES file for each candidate fixture and check the zonal lumens breakdown. If more than 40 percent of the total lumens fall into the 60–90 degree zone, the fixture wastes light sideways and upward, creating glare and light pollution. Reject it. Next, verify the BUG rating. A fixture rated B3-U2-G3 might look appealing on price, but it won’t qualify for DesignLights Consortium rebates, and your client loses thousands in incentive funding.
Cross-reference every candidate against the DLC Qualified Products List and confirm the listing ID matches the exact fixture model, wattage, and color temperature. Manufacturers sometimes update optics or drivers between production runs, which invalidates older IES files. Request the IES file directly from the manufacturer’s website or from a reputable library like ies-library, which hosts nearly 200,000 files. Verify that the file matches the product spec sheet before proceeding. Never substitute a similar file or assume one fixture’s data applies to another. This single mistake cascades through your entire design.
Validate Designs Through Simulation
Once you’ve narrowed candidates to three or four fixtures that meet your performance criteria, validate your design using simulation software. Import the IES files into DIALux evo or AGi32 and model your actual space with real dimensions, reflectances, and mounting heights. Run illuminance analysis to confirm that your chosen fixture layout delivers the target fc levels and uniformity ratios across the entire area.
Test multiple spacing configurations. For general warehousing, try a spacing-to-mounting-height ratio between 1.0 and 1.5. For inspection zones, tighten it to 0.7–1.0. Simulate the results and compare. A 120-degree beam angle might look attractive, but simulation often reveals dark spots in aisles or excessive glare in picking zones. A narrower 60–90 degree beam with better zonal lumen distribution solves both problems.
Generate Reports and Build Your Submittal Package
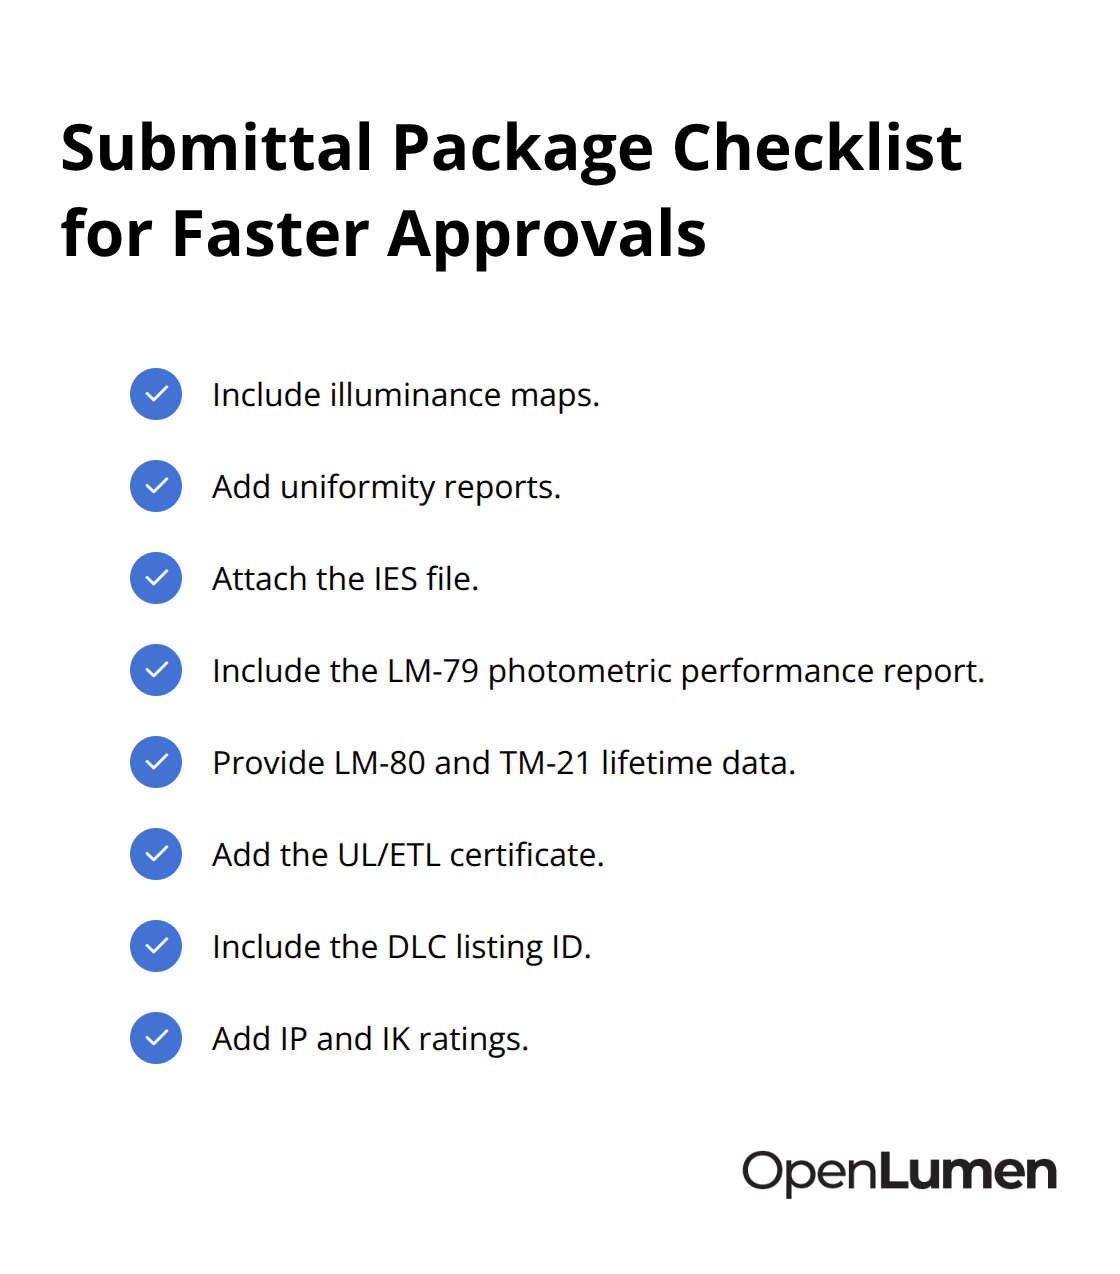
Generate illuminance maps and uniformity reports directly from the software. These reports become part of your submittal and prove to engineers and inspectors that the design meets code requirements before a single fixture ships to the site. Include the IES file itself, the LM-79 photometric performance report, LM-80 and TM-21 lifetime data, the UL/ETL certificate, the DLC listing ID, and the IP and IK ratings in your submittal package. This documentation accelerates approvals and eliminates request-for-information cycles that delay projects.
Streamline Selection With the Right Tools
Whether you use specialized design tools or a browser-based platform, the principle remains the same: validate every design against real photometric data before installation begins. OpenLumen provides a free, browser-based platform that lets you access polar charts, BUG ratings, and zonal lumens for thousands of community-verified fixtures in seconds, streamlining the selection and validation workflow without expensive software or complex setup.
Final Thoughts
Photometric data transforms how you select, validate, and install lighting. The difference between guessing at fixtures and designing with real candela values, zonal lumens, and BUG ratings appears immediately in project performance, energy bills, and client satisfaction. When you match IES files to actual fixtures, simulate designs before installation, and validate illuminance and uniformity against real performance targets, you avoid dark spots, glare problems, and costly retrofits.
A submittal package that includes the IES file, LM-79 report, lifetime data, and UL/ETL certification removes friction with engineers and inspectors. You show them proof that the design works before installation begins rather than asking them to trust your judgment. This IES photometric data guide approach accelerates approvals, qualifies projects for rebates because designs hit DLC thresholds, and reduces energy consumption because light reaches task surfaces instead of wasting upward or sideways.
Start your next project by defining performance targets: illuminance levels, uniformity ratios, and glare limits for your space. Filter candidate fixtures against those targets using their IES files, simulate your top choices in design software, and generate reports that build a complete submittal package. OpenLumen streamlines this workflow with a free, browser-based platform that gives you instant access to polar charts, BUG ratings, and zonal lumens for thousands of verified fixtures, letting your team design, validate, and sell lighting faster and with confidence.
The information provided is for general educational purposes only and should not be considered professional engineering or lighting design advice. Always verify project requirements, local codes, and specifications with qualified professionals before making final decisions.