Bad photometric layouts waste money. Contractors install fixtures in the wrong spots, clients complain about dark corners, and projects go over budget because nobody validated the design upfront.
At OpenLumen, we’ve seen this happen hundreds of times. The fix is simple: follow photometric layout best practices before you build anything. This guide walks you through the exact process-from understanding what metrics matter to using tools that catch problems before installation.
What Photometric Layouts Actually Measure
The Foundation: Three Metrics That Matter
A photometric layout is your blueprint for light. It tells you exactly how much light lands on every surface, where dark spots will appear, and whether your fixture placement actually works before installation crews show up on site. Without it, you’re guessing. With it, you know.
Photometric layouts rest on three core measurements that affect real-world performance. Illuminance, measured in lux or footcandles, quantifies how much light actually hits a surface-this is what your client sees and feels in the space.
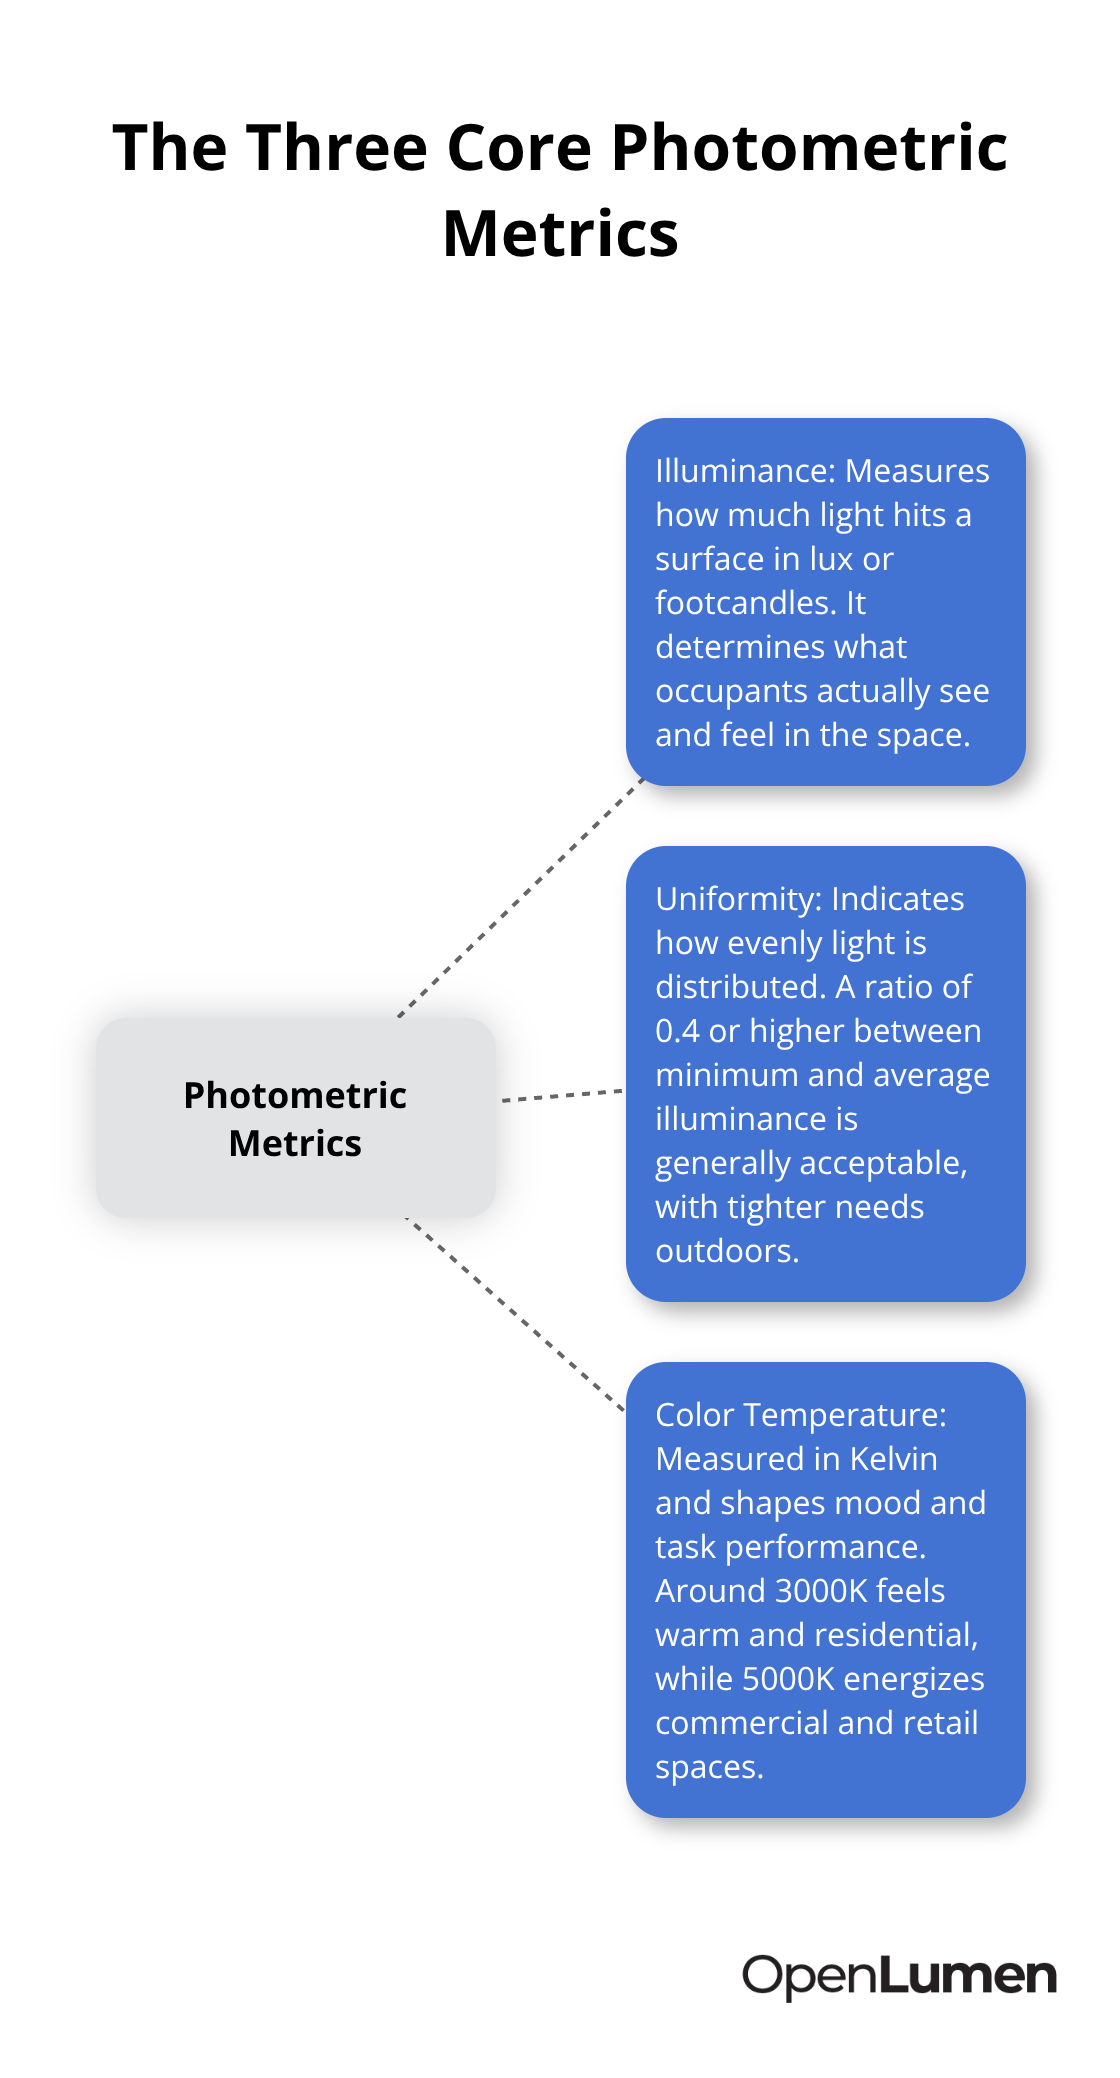
Uniformity tells you whether light distribution is even or spotty; a ratio of 0.4 or higher between minimum and average illuminance is generally acceptable for most applications, though outdoor parking lots and sports fields demand tighter uniformity to eliminate dark patches and safety hazards. Color temperature, measured in Kelvin, affects mood and task performance; 3000K feels warm and residential, while 5000K energizes commercial workspaces and retail environments.
How These Metrics Work Together
These three metrics interact to shape the final result. A 500-lux office space with poor uniformity creates eye strain and frustration because workers face bright spots next to dim zones. That same 500 lux distributed uniformly across the space feels comfortable and supports productivity.
The Illuminating Engineering Society of North America recommends specific illuminance targets for different spaces-offices need 300 to 500 lux at desk height, retail displays need 500 to 1000 lux to showcase products, and parking lots need 10 to 20 lux for safety and wayfinding. Missing these targets costs money twice: first through wasted energy from over-lighting, and second through client dissatisfaction and rework.
Why Designers Fail Without Validation
Common design mistakes stem from skipping the measurement step entirely. Too many contractors place fixtures based on habit or symmetry rather than actual light output, resulting in dark corners and wasted lumens in areas that don’t need them. Others ignore color temperature mismatches, mixing 3000K and 5000K fixtures in the same space, which looks unprofessional and throws off the client’s perception of the entire installation.
A third mistake is treating uniformity as optional; uneven lighting in retail spaces drives customers away, while inconsistent brightness in warehouses creates safety risks and reduces worker accuracy. The worst error is designing without simulating first. Real-world conditions-ceiling height, surface reflectance, mounting position, and fixture orientation-dramatically affect actual light delivery. A fixture that performs perfectly on a spec sheet may fall short in a high-bay warehouse with dark walls or overperform in a low-ceiling office with white surfaces.
Validating your design with photometric analysis before ordering materials and scheduling installation prevents costly corrections and keeps projects on timeline and budget. This validation step separates confident designers from those who hope their layouts work. The next section shows you exactly how to assess your space and define the requirements that drive every decision forward.
How to Build a Photometric Layouts That Actually Work
Measure Your Space and Document What Happens There
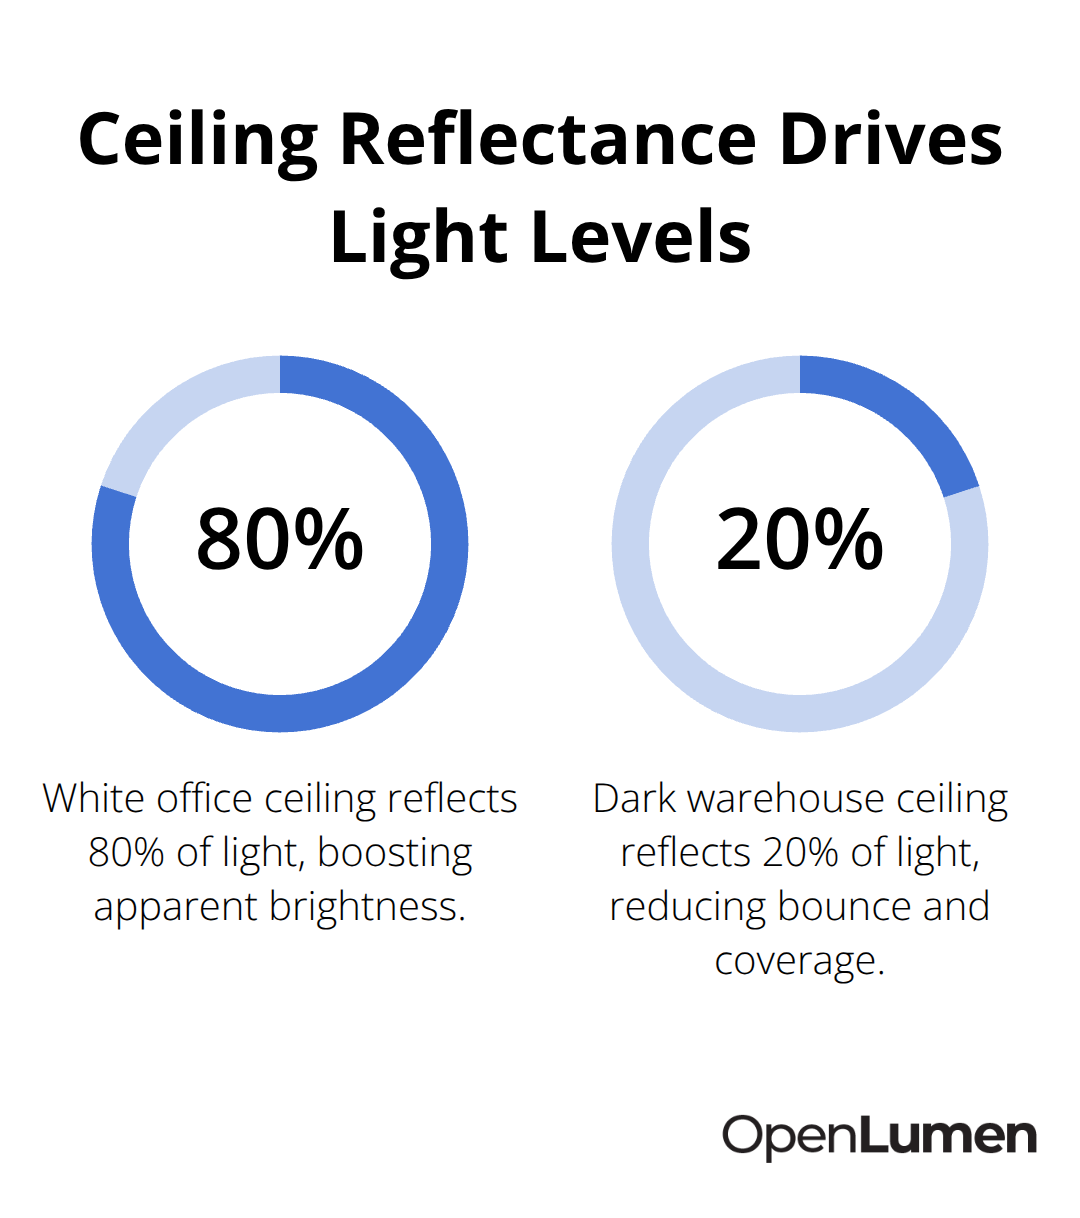
Measure your space first and document exactly what happens in each zone. Capture room dimensions, ceiling height, and mounting positions where fixtures will hang. Photograph the surfaces-walls, floors, ceilings-because their reflectance values dramatically affect how light bounces and distributes. A white office ceiling reflects 80 percent of light, while a dark warehouse ceiling reflects only 20 percent, which means the same fixture delivers vastly different results in each space.
Note the tasks performed in each zone: a workstation needs 300 to 500 lux according to the Illuminating Engineering Society of North America, while a parking lot needs only 10 to 20 lux. A retail display requires 500 to 1000 lux to make products stand out. Once you know the task, you know the illuminance target. This is not negotiable-guessing at light levels wastes money and frustrates clients.
Select Luminaires Based on Performance Data
Choose luminaires that match your illuminance targets and uniformity requirements. Don’t select fixtures based on appearance alone; request photometric data sheets that show polar curves, zonal lumens, and candela values. A 100-watt LED high-bay with a narrow beam pattern concentrates light in a tight footprint, perfect for warehouse aisles where you need 300 lux on the floor below 20-foot ceilings. The same wattage in a wide-beam fixture spreads light across a larger area at lower intensity, better for low-ceiling retail spaces needing 500 lux at eye level. Compare fixtures side by side using their actual photometric performance, not marketing claims.
Color rendering index matters too-a CRI of 90 or higher preserves the true color of products and finishes, while 80 CRI looks washed out and cheap. For offices and retail, try 5000K to energize the space; for hospitality and residential, 3000K creates warmth. Mixing color temperatures in the same space is a rookie mistake that looks unprofessional and confuses the eye.
Position Fixtures Based on Calculations, Not Symmetry
Position fixtures based on calculations, not symmetry. A perfectly centered grid of lights often leaves dark corners and creates uneven distribution. Instead, use photometric software to run point-by-point illuminance calculations across the entire space. Place fixtures closer together near walls and corners where light naturally spreads less, and space them farther apart in the center where beams overlap effectively.
For a 40-by-60-foot office with 9-foot ceilings and 500-lux target, you might need 24 fixtures in a 4-by-6 grid-but only if calculations confirm even distribution. Skip this step and you’ll install 30 fixtures, waste energy, and still face complaints. Uniformity ratios of 0.4 or higher between minimum and average illuminance keep spaces comfortable; anything lower creates visible bright spots and dark patches that trigger eye strain.
Validate Your Layout Before Installation
Test your layout in software before ordering materials. Real-world variables-voltage drop, dirt accumulation, and aging-reduce actual output by 10 to 20 percent, so design with a safety margin built in. A layout that calculates to exactly 500 lux will drop to 400 lux after six months of operation, leaving your client frustrated. This validation step separates confident designers from those who hope their layouts work. With your space measured, fixtures selected, and layout validated, you’re ready to move into the tools and workflows that transform your design into a professional report that installers can execute without confusion.
Software That Validates Your Design Before Installation
Real-Time Analysis Catches Problems Before Installation
Professional photometric software eliminates guesswork by running instant calculations on your layout and flagging problems before crews arrive on site. You input your space dimensions, select fixtures from a verified luminaires library, position them on a 2D or 3D floor plan, and the software immediately calculates illuminance at every point, uniformity ratios, and whether you meet your targets. This feedback loop saves hours compared to manual calculations and prevents the costly mistakes that come from designing without validation. The software shows you exactly where dark spots will appear, which fixtures are oversized or undersized for the task, and whether your color temperature choices match the space’s purpose.
A 40-by-60-foot office layout that takes three hours to calculate by hand runs in seconds in software, and you can test five different fixture arrangements in the time it would take to hand-calculate one. Real-time analysis also catches errors that spreadsheets miss-a fixture mounted 2 feet higher than planned drops illuminance by 15 to 20 percent, which software reveals instantly so you can adjust spacing or wattage before ordering. This validation step prevents over-lighting, which wastes energy and money, and under-lighting, which triggers client complaints and rework requests.
Professional Reports That Installers Actually Use
Once your layout is validated, the software generates professional reports that installers can execute on site without confusion. A complete report includes a photometric plan showing exact fixture positions and mounting heights, point-by-point illuminance calculations formatted in a heatmap so installers see light distribution at a glance, and a luminaire schedule listing product names, quantities, and specifications for procurement. These reports also document compliance with local codes and industry standards from the Illuminating Engineering Society of North America, which protects you if disputes arise later.
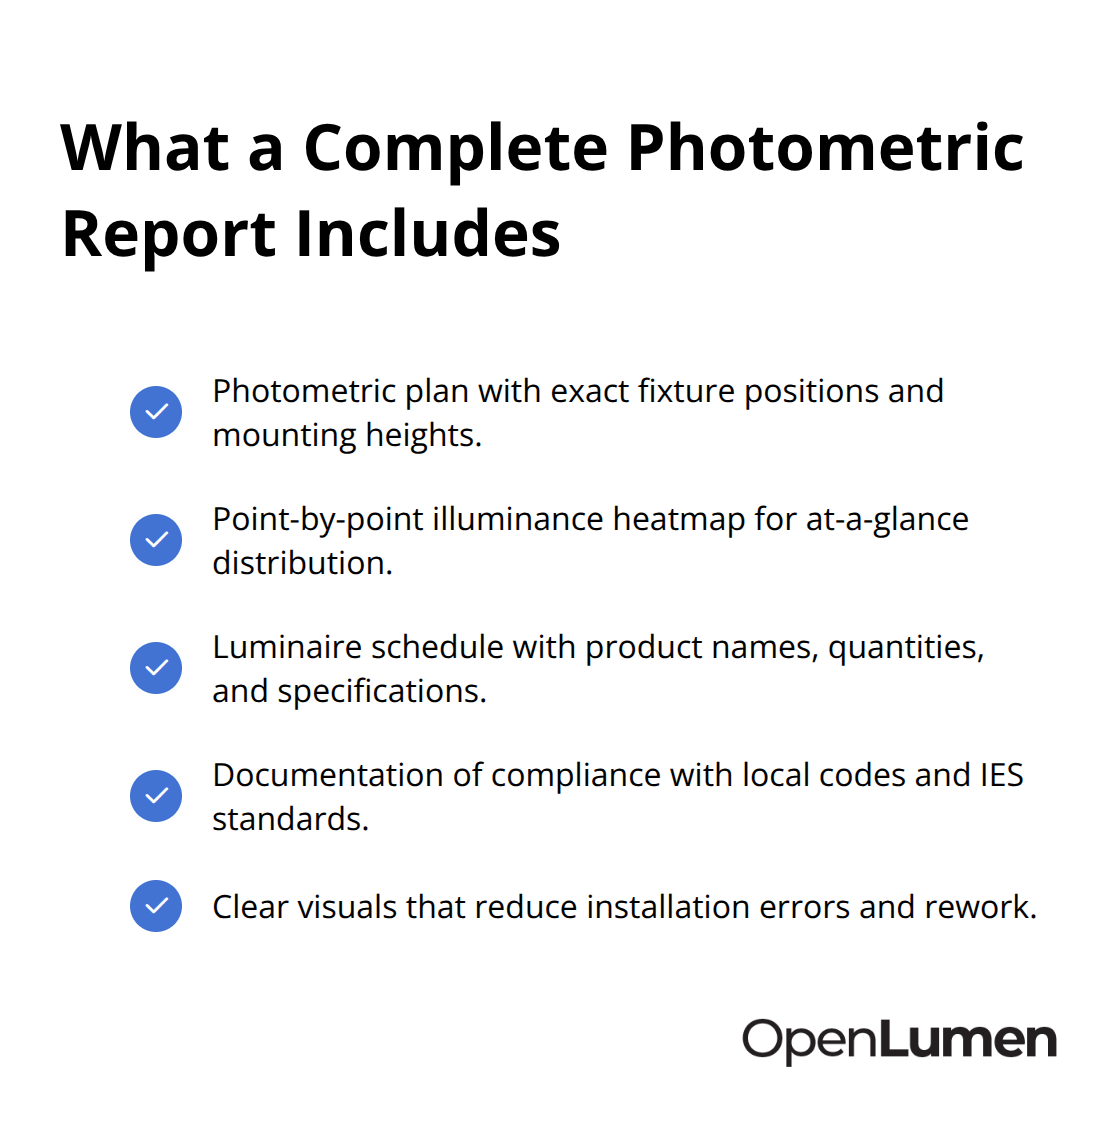
Installers receive clear, visual guidance instead of vague instructions, which reduces installation errors and rework. Sales teams use these reports to show clients exactly what they’re buying before construction begins, which builds confidence and closes deals faster. A retailer considering a 5000-lux display upgrade sees a heatmap proving the layout delivers uniform brightness across products, not a sales pitch.
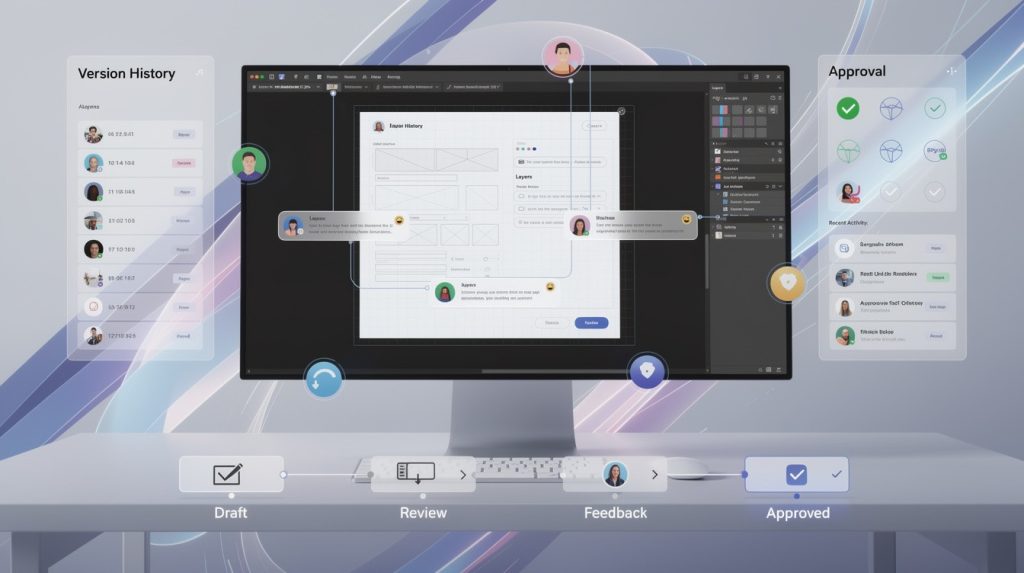
Unified Communication Across Teams
Designers and installers must communicate through the same plan, not separate documents that contradict each other. When design, sales, and installation teams work from one validated report, change orders drop, timelines hold, and client satisfaction improves measurably. The report becomes the single source of truth that every stakeholder references, which eliminates the back-and-forth that delays projects and inflates costs. OpenLumen’s community-verified luminaires library and instant metrics (polar charts, BUG, zonal lumens) streamline this workflow so teams can design, sell, and validate lighting faster and with confidence.
Final Thoughts
Photometric layout best practices rest on three core actions: measure your space accurately, validate your design before installation, and use tools that catch errors before they become expensive problems. Skip any of these steps and you’ll face dark corners, wasted energy, over-budget projects, and frustrated clients. Follow them and you’ll install lighting that performs exactly as promised.
Modern photometric software eliminates the guesswork that plagues traditional design workflows. Instead of hoping your fixture placement works, you run instant calculations that show illuminance at every point, uniformity ratios, and compliance with industry standards from the Illuminating Engineering Society of North America. This validation happens in minutes, not hours, and reveals problems before crews arrive on site-a fixture mounted too high, a dark corner that needs an extra light, or an over-lit zone that wastes energy all surface before you order materials or schedule installation.
Tools like OpenLumen make this workflow accessible to contractors, distributors, and facility owners without expensive software or steep learning curves. A community-verified luminaires library, real-time analysis, and professional report generation streamline the entire design-to-install process so your team works faster and with confidence.
The information provided is for general educational purposes only and should not be considered professional engineering or lighting design advice. Always verify project requirements, local codes, and specifications with qualified professionals before making final decisions.